
How to Create an Org Chart
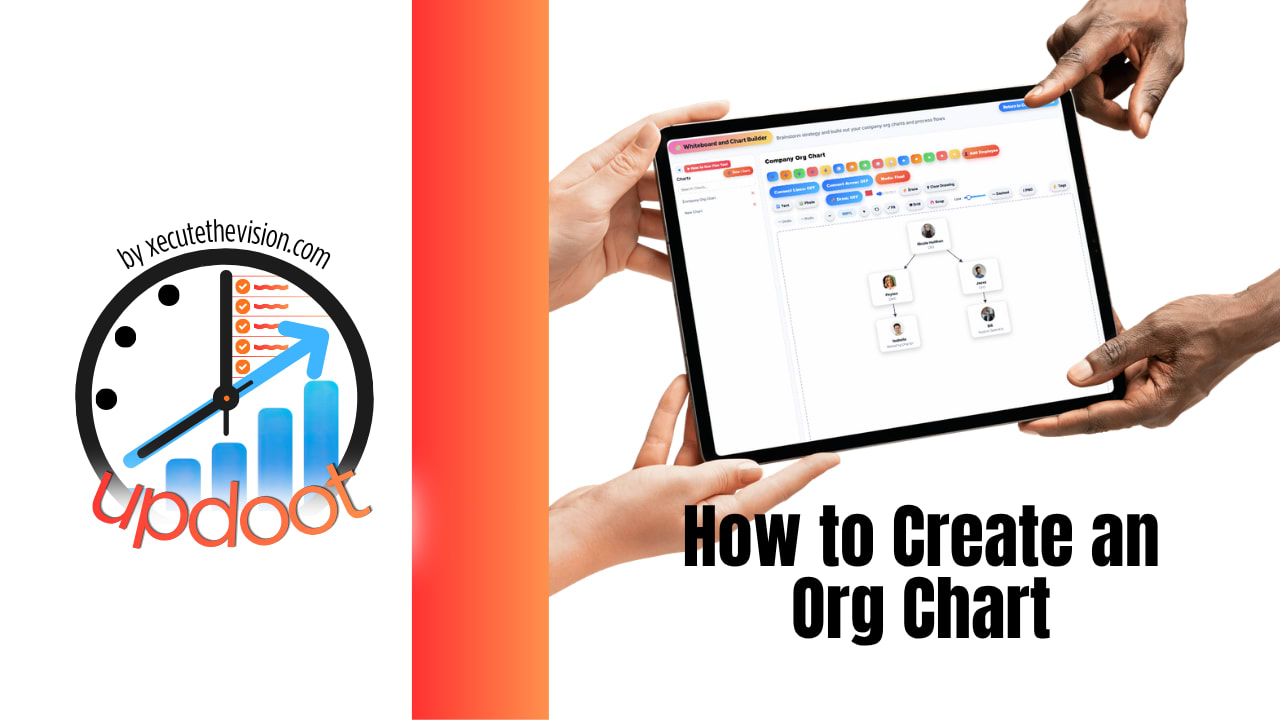
An org chart is the cheapest clarity tool a company owns, and most of them are wrong within a quarter of being drawn. What a business loses without an accurate one is rarely visible as a line item: the new hire who spends three weeks working out who approves what, the decision that stalls because two people believe they own it, the manager quietly carrying nineteen direct reports while another carries two. Below is how to build one properly, every structure type with a diagram, the steps in order, and the pitfalls that make most charts obsolete.
Free Span of Control Calculator
Is Your Structure Balanced?
Enter your headcount and management layers. This is the check most people skip before drawing the chart.
What an Org Chart Is Actually For
Most people treat an org chart as a picture of who is senior. That is the least useful thing it does, and aiming at it produces a status diagram nobody consults.
A working org chart answers four operational questions: who does someone report to, who owns a given area, who approves a given decision, and who a new hire should go to with a specific problem. If your chart cannot answer those, it is decoration.
It also serves a second purpose people underrate. Drawing the structure honestly exposes structural problems that were invisible in prose: duplicated ownership, managers with impossible spans, whole functions with no clear owner, and layers that exist for title reasons rather than work reasons. The chart is a diagnostic before it is a communication tool.
The Types of Org Chart
There are more structures than most companies realize, and picking the wrong one produces a chart that fights the business it describes. Here is each type, what it looks like, and when it is the right choice.
Hierarchical (traditional)
Hierarchical: one reporting line per person, authority flows top down.
The default and still the right answer for most small and mid-sized companies. Every person has exactly one manager, and authority flows down a single line. It is unambiguous, easy to read, and easy to maintain.
Use it when accountability needs to be obvious and the business does not routinely staff people across competing priorities. Watch for layer creep: hierarchies accumulate levels as a way of granting titles, and every extra layer slows decisions.
Functional
Functional: people grouped by specialty under a functional head.
A hierarchy organized around disciplines: sales, operations, finance, marketing. Expertise concentrates, career paths are clear, and standards within a function stay consistent.
Use it when depth of craft matters more than cross-functional speed. Watch for silos: functional charts make it easy for departments to optimize for themselves and hand problems across the boundary.
Flat (horizontal)
Flat: few or no middle layers, wide spans, high autonomy.
Few or no middle managers. Decisions move fast because there is almost nothing between the person doing the work and the person who can approve it.
Use it when you are small, the work is autonomous, and the people are senior. Watch for the ceiling: flat structures break somewhere between twenty and forty people, when the founder's span becomes unmanageable and there is no career path to offer anyone.
Matrix
Matrix: each person has a functional manager and a project or product lead.
People report to a functional manager for craft, career, and performance, and to a project or product lead for the work itself. Solid line and dotted line.
Use it when specialists must be shared across concurrent projects, which is common in agencies, engineering, and professional services. Watch for the failure mode this structure is famous for: when two bosses set conflicting priorities and nobody has defined who wins, the employee absorbs the conflict. Matrix only works if you write down, explicitly, who arbitrates.
Divisional
Divisional: self-contained units by product, market, or geography.
The company splits into semi-autonomous units by product line, customer segment, or region, each carrying its own functions. Divisions can be measured on their own results and can move without waiting for the whole company.
Use it when the units genuinely serve different markets. Watch for duplication: three divisions with three marketing teams cost more than one, and it is only worth it if the markets really are distinct.
Team-based
Team-based: cross-functional pods that own an outcome end to end.
Cross-functional pods own an outcome from start to finish rather than handing work between departments. Common where speed and customer ownership matter more than functional depth.
Use it when handoffs between departments are your bottleneck. Watch for the craft problem: with no functional home, specialists lose their standards and their career path, which is why most team-based structures are really matrices with a friendlier name.
Network and circular
Two less common variants worth knowing. A network chart maps a small core of employees surrounded by contractors, agencies, and partners, which is honest for businesses where much of the work is outsourced and a traditional chart would show a misleadingly tiny company. A circular chart places leadership at the centre with rings radiating outward, intended to signal collaboration rather than command. Circular charts are genuinely harder to read and to maintain, and they obscure the reporting lines people consult a chart to find. Use one for a culture deck if you like, but keep a hierarchical version for actual operations.
How to Create an Org Chart, Step by Step
Step 1: Decide what the chart is for
Before drawing anything, answer who will use it and for what. A chart for new hire onboarding needs roles, responsibilities, and photos. A chart for workforce planning needs vacancies, costs, and headcount. A chart for a board deck needs the top three layers and nothing else. Building one chart for all three produces something that serves none of them.
Step 2: Pull accurate people data
Export a current list: name, job title, department, manager, location, and start date. Pull it from your HR system rather than memory, because the differences between what the system says and what people believe are exactly the errors you are trying to catch. If several sources disagree, resolve that now, not after the chart is published.
Step 3: Choose the structure type
Pick from the types above based on how the work actually flows, not on what sounds modern. If specialists are shared across projects, you have a matrix whether or not you draw one, and drawing a clean hierarchy will simply hide it.
Step 4: Map reporting lines
Start at the top and work down, one level at a time. Every person gets exactly one solid line to the manager who owns their performance, pay, and career. Anything else, project leads, functional advisors, is a dotted line and should be visually distinct.
Step 5: Show roles, not just names
A box containing only a name is useless to the person most likely to consult the chart: someone new. Include the job title, and for key roles a short line on what they own. "Priya Raman, Operations Manager, owns scheduling and vendor relationships" answers a question. A name alone starts one.
Step 6: Handle the exceptions honestly
Every real organization has them, and how you draw them determines whether the chart is trusted. Show vacancies as open boxes rather than omitting them, since a hidden gap is a planning failure. Mark contractors and agencies distinctly so headcount reads correctly. Show interim and acting arrangements as such rather than as permanent. For dual reporting, use the dotted line and note who arbitrates a conflict. Where one person holds two roles, show both boxes, because pretending otherwise hides a key-person risk.
Step 7: Check span of control and layers
Run the numbers from the calculator above before you publish. Look at individual managers, not just the average. A manager with sixteen direct reports is not coaching anyone, and a manager with one is usually a title in search of a job. Count layers too: every additional level between a decision and the person doing the work adds delay.
Step 8: Validate with managers before publishing
Send each manager their branch and ask them to confirm it. This single step catches most errors, and it surfaces the interesting ones: two people who each believed they owned something, a reporting line that changed informally months ago, a person on a team nobody had updated. Expect disagreement, and treat it as the chart doing its job.
Step 9: Publish where people will actually look
A chart in a file someone has to request is a chart nobody reads. It belongs where employees already go, alongside the directory and the policies. If a new hire cannot find it unaided in their first week, the format is wrong regardless of how good the content is.
Step 10: Assign an owner and a refresh cadence
Name a person responsible and pick a rhythm, monthly for a growing company, quarterly for a stable one, plus an update whenever someone joins, leaves, or moves. Without an owner, every chart decays, and a chart people know is stale is worse than none because it teaches them not to trust the source.
Considerations Most Guides Skip
Privacy. An org chart is widely visible, so it should carry role information and not personal data. Salary, home address, personal phone numbers, and performance ratings do not belong on it. Where charts include photos, make participation optional.
Remote and multi-site teams. Adding location and time zone turns the chart from a reporting diagram into a practical collaboration tool, because the question behind "who owns this" is frequently "and are they awake."
Current state versus future state. Keep them as separate documents and label them clearly. Publishing a planned structure as though it exists creates confusion at best and anxiety at worst, since people will read a box that does not yet exist as a decision that has already been made about them.
Access levels. Everyone should see the structure. Not everyone needs to see vacancies, costs, or planning scenarios. If your tool cannot separate those, keep planning work somewhere else.
Title inflation. Charts make titles visible, and visibility invites comparison. If your titles have drifted so that three people with the same level have very different scope, drawing the chart will surface it. That is worth fixing rather than hiding.
Common Pitfalls
Drawing the org you wish you had. The most common failure. Charts get drawn as they should be rather than as they are, which makes them useless for the daily questions people actually consult them for. Draw reality first; put the aspiration in a separate future-state document.
Building it once and never updating it. A chart is a living record, and a company of any growth rate invalidates one within a quarter. Most charts die here.
Keeping it in a slide deck or a diagramming file. Related, and the mechanical reason charts go stale. When updating means opening a file, dragging boxes, re-exporting, and re-sharing, it will not happen at the frequency reality demands.
Names without roles. Useless to a new hire, who does not yet know who anyone is.
Dotted lines everywhere. Once a chart has more dotted lines than solid ones, it has stopped communicating. If everything is connected to everything, write the operating model down in prose instead.
Treating it as a status document. When people negotiate box position and title rather than responsibility, the chart has become political and will be drawn to flatter rather than to inform.
Hiding vacancies. Omitting open roles makes the organization look complete when it is under-resourced, which is precisely the information leadership needs.
Ignoring what it reveals. A chart that exposes a manager with nineteen reports, or a function with no owner, has done something valuable. Publishing it and changing nothing wastes the diagnostic.
No named owner. Shared responsibility for maintenance means no maintenance.
Questions to Ask Before Choosing a Tool
- Is the chart a diagram or is it data? This is the central distinction. Diagramming tools store shapes, so every change is manual. Data-driven tools build from your employee records, so the chart follows reality.
- How does it update? Manual drag, CSV re-import, or live from your people records. That answer determines whether the chart is current in six months.
- Is pricing per seat, per employee, or flat? Per-seat pricing punishes company-wide visibility, which is the whole point of a chart. Per-employee pricing rises as you hire.
- Is there a headcount minimum? Some tools bill a floor regardless of size, so a 60-person company can pay as though it had 100.
- Can everyone view it without a licence? If viewing requires a seat, most of your staff will never open it.
- Does it handle dotted lines, vacancies, and contractors? Every real org has these, and a tool that cannot represent them forces you back into a drawing tool.
How We Evaluated These Tools
A note on where we stand: Updoot publishes this site and appears in the comparison below. Pricing and features for every tool here, Updoot included, were verified against each vendor's live pricing page or independent third-party sources in August 2026, and Updoot's own limitations are listed in the same column as everyone else's.
For building and maintaining an org chart specifically, we weighted five things: whether the chart is generated from employee data or drawn by hand, how it stays current, whether all staff can view it without a per-seat cost, support for dotted lines and vacancies, and total cost at small and mid-sized headcounts.
How the Top Org Chart Tools Compare
| Tool | Starting Price | Best For | Where It's Limited |
|---|---|---|---|
| Updoot ⭐ Best Overall | $5/user/month, all features included | Companies wanting the org chart built from the same employee records that hold roles, reviews, PTO, and SOPs, so it stays current without a separate update job | No third-party HRIS sync from Workday or ADP, and no scenario modeling with budget impact for large reorganizations |
| Lucidchart | Free for 3 documents; from ~$9/user/month with a 3-seat minimum | Teams that diagram many things and need an org chart only occasionally | Org charts are diagrams rather than data, so every change means dragging boxes; per-seat pricing climbs as you add editors |
| Canva | Free tier with basic templates; paid from ~$15/month | One-off presentation charts that need to look polished | Manual everything, with no connection to employee data and no update workflow |
| Visio | Reported ~$5-$15/user/month | Microsoft-centric organizations with an established shape library | Live data linking is locked to the Windows desktop app, and the experience is widely described as dated |
| Pingboard | Reported from ~$149/month for up to 50 employees | Companies wanting an org chart plus a rich employee directory | Per-user pricing gets expensive fast when you want company-wide access |
| ChartHop | Reported ~$8/employee/month; Core plan reported near $9,600/year at 100 people | Larger companies with a People Ops function needing analytics and headcount planning | Real-world contracts are reported far above the entry figure; substantial overkill for a company that wanted a chart |
Editor's Pick
Why Updoot Tops This List
This category is split badly. On one side are drawing tools, Lucidchart, Canva, Visio, where the chart is a picture of boxes with no connection to your actual people, so it is accurate on the day you make it and wrong a month later. On the other are people-data platforms, Pingboard from around $149 a month, ChartHop reported near $9,600 a year at 100 people, which keep the chart current but cost platform money for something you wanted as a chart. Updoot builds the org chart from the employee records already in the system, so when someone is hired, promoted, or moves teams, the chart reflects it without anyone opening a diagramming file. Every employee can view it at the same flat $5 per user per month that covers HR records, reviews, PTO, SOPs, projects, and time tracking, with no per-seat viewing charge and no headcount minimum. A 64-person company pays $320 a month for all of it.
To be direct about the tradeoff: if you are running a large reorganization and need to model scenarios with compensation and budget impact, or you need live sync from Workday or ADP, a dedicated people-data platform does that and Updoot does not.
How Updoot Builds and Maintains the Chart
In Updoot, the org chart is generated from the employee records in the employee vault rather than drawn separately, which removes the maintenance step that kills most charts. Roles, departments, and reporting lines come from the same data that drives reviews and PTO, so a change made once appears everywhere.
Because roles live alongside the chart, it answers ownership rather than just hierarchy. Procedures in the SOP library are assigned to roles, so a new hire moving from the chart to "what does this person actually own" does not leave the platform. For projects, a RASCI chart handles the responsibility mapping the org chart deliberately does not, which is the right division of labour between the two documents.
Every employee can view it as part of their normal access, which matters because a chart only visible to people with a licence is a chart most staff never open. If you would rather sketch a structure before committing to it, the free org chart planner is a place to draft roles and responsibilities first.
Signs Your Org Chart Isn't Working
The tipping point usually announces itself the same way: new hires ask who owns something rather than looking, the chart on file shows people who left, two managers each believe they own the same function, nobody can say how many open roles exist without building a list, and the last update was made by someone who has since changed jobs. When the chart is less current than the hallway, people stop consulting it, and at that point it is costing you the time it was meant to save.
Related Reading
Best HR Software for Remote Teams →
How to Manage Multiple Projects at One Time →
Frequently Asked Questions
Decide what the chart is for, pull accurate people data from your HR system, choose the structure type that matches how work actually flows, map one solid reporting line per person, show roles rather than just names, mark vacancies and dotted lines honestly, check span of control, validate each branch with its manager, publish it where staff already look, and assign an owner with a refresh cadence.
The main types are hierarchical, functional, flat or horizontal, matrix, divisional, and team-based, plus two less common variants: network charts that include contractors and partners, and circular charts that place leadership at the centre. Hierarchical suits most small and mid-sized companies because it is unambiguous and easy to maintain.
Roughly five to nine direct reports per manager works for most teams. Below three usually means too many management layers, and above fifteen means the manager cannot realistically coach anyone. Look at individual managers rather than the average, since a healthy average can hide one person with nineteen reports and another with two.
Name, job title, department, and reporting line at minimum, plus a short note on what key roles own. Include vacancies as open boxes and mark contractors distinctly. Leave out personal data such as salary, home address, and performance ratings, since the chart is widely visible.
A solid line goes to the manager who owns someone's performance, pay, and career, and each person should have exactly one. A dotted line shows a secondary relationship such as a project or product lead. If you use dotted lines, write down explicitly who arbitrates when the two set conflicting priorities.
Monthly for a growing company and quarterly for a stable one, plus an update whenever someone joins, leaves, or changes reporting line. Charts kept in slide decks or diagramming files tend to go stale because updating means opening a file and dragging boxes, which does not happen at the frequency reality demands.
Drawing the organization you wish you had rather than the one you have, never updating it, listing names without roles, hiding vacancies, using so many dotted lines that the chart stops communicating, treating box position as a status negotiation, and failing to name one person responsible for maintenance.
Final Takeaway
Draw the organization you have, show roles rather than just names, mark the vacancies and the dotted lines honestly, and give one person responsibility for keeping it current. The structure type matters less than accuracy: a plain hierarchical chart that is right beats an elegant one that is three months out of date. Run the span of control numbers above before you publish, because the chart's first job is telling you something you did not already know.