
Easy-to-Use Dashboard for Small Business
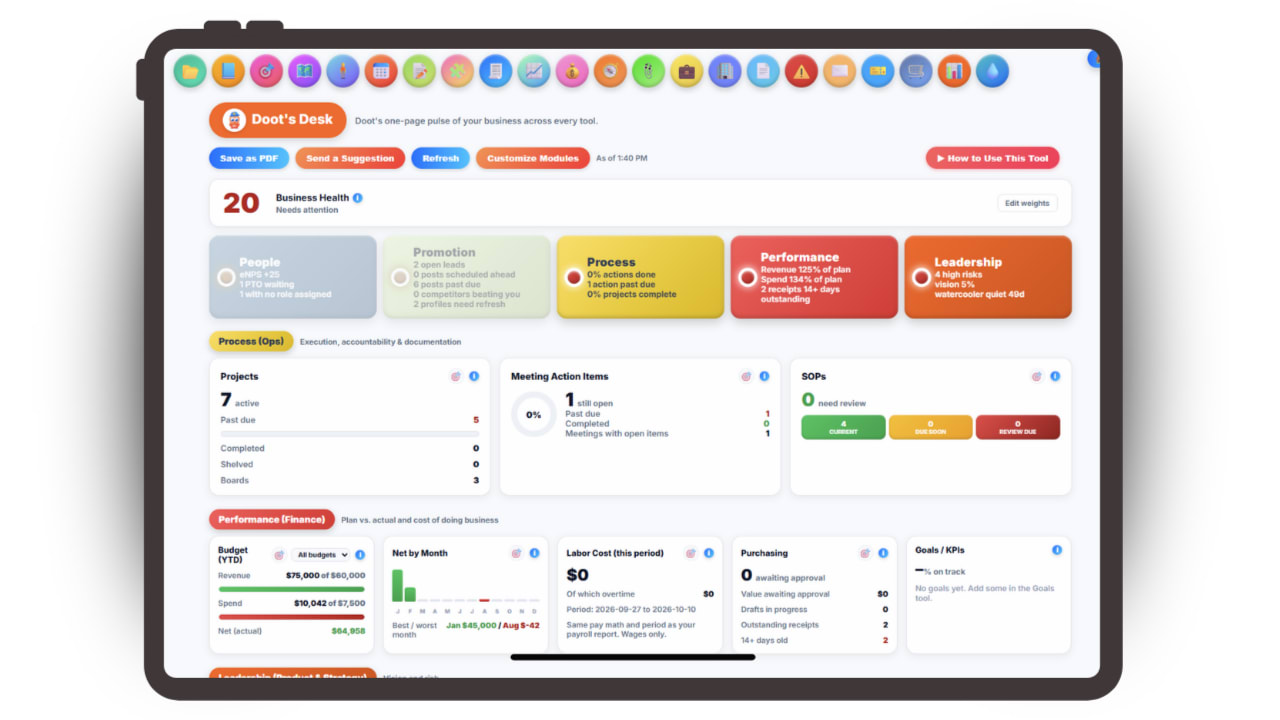
Stop pulling numbers from five places to figure out how the business is doing. Doot's Desk shows all five levers live, each flagged green, yellow, or red, so you know where to look first before you've had your coffee.
Here is how Doot's Desk shows the health of your whole business on one screen.
People, Promotion, Process, Performance, and Product, side by side.
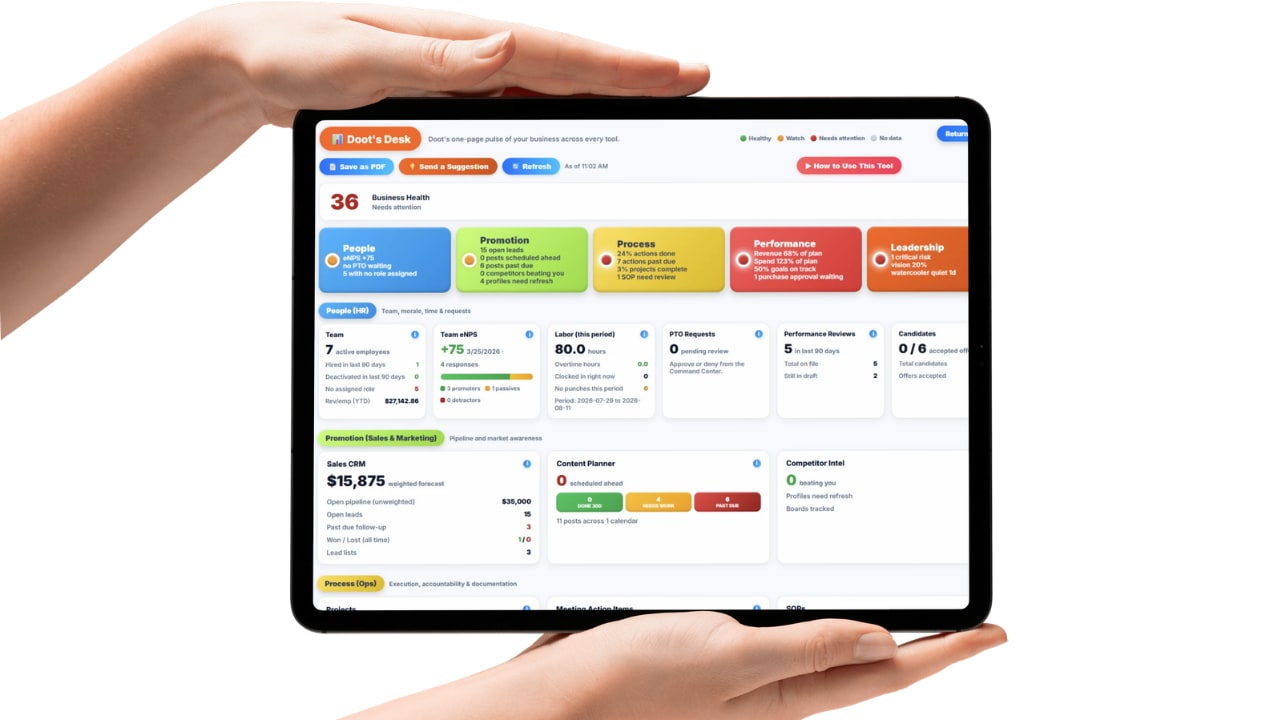
Your business runs on five levers: People, Promotion, Process, Performance, and Product. Most owners can tell you how one or two are doing at any given moment, usually the one that caused a problem most recently.
Doot's Desk puts all five on one live screen. HR next to sales and marketing, operations next to finance, leadership alongside them, so you're looking at the whole business rather than whichever piece is loudest this week.
That side-by-side view is what surfaces the trade-offs. Sales climbing while operations slides usually means you've won work the team can't deliver, and that's a pattern you only catch when both are in front of you at the same time.
Know where to look first without reading a single report.
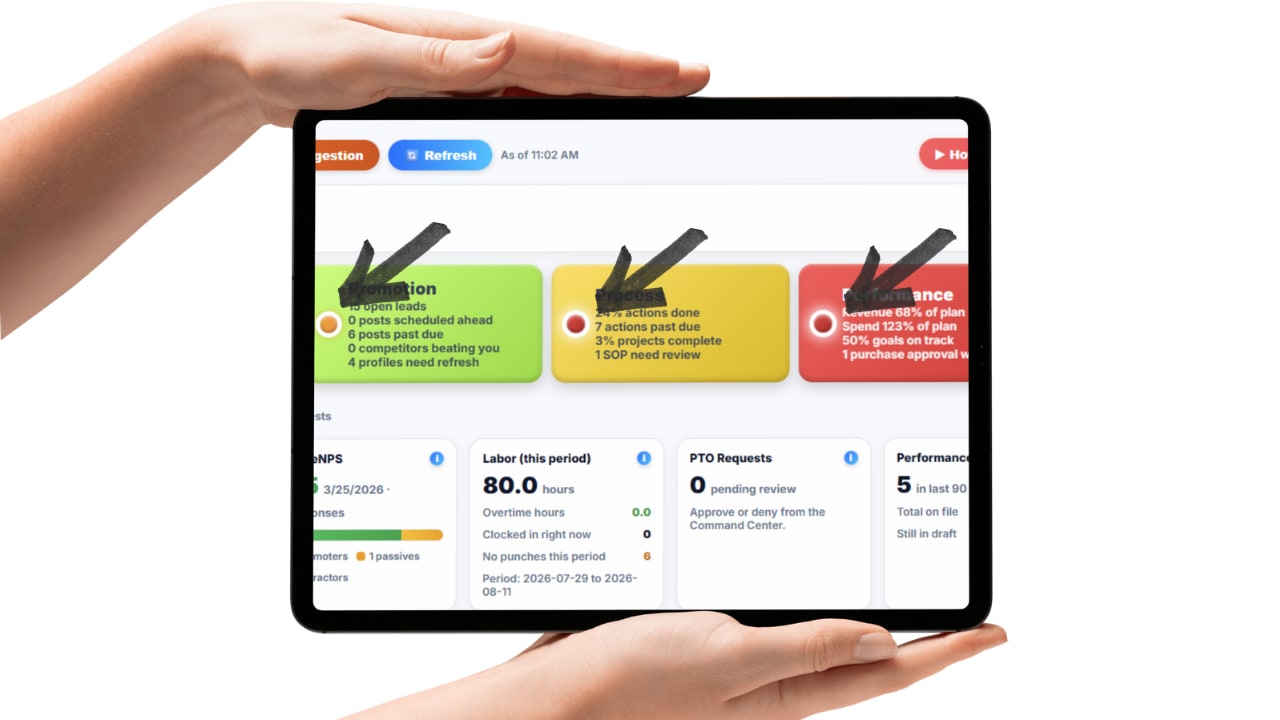
Each lever carries a status color. Green means it's holding, yellow means it's drifting, red means it needs you today. That's the entire interface, and it's deliberate.
A dashboard that requires interpretation doesn't get checked. One that answers "where should I spend my attention this morning" in about three seconds becomes part of the routine, which is the only way a metric ever changes behavior.
And because Doot assembles it from every tool automatically, there's no setup phase and no report to build. The data comes from the work your team is already doing, so the picture stays current instead of reflecting whenever someone last updated a spreadsheet.
One number for the whole business, and a target on every metric behind it.
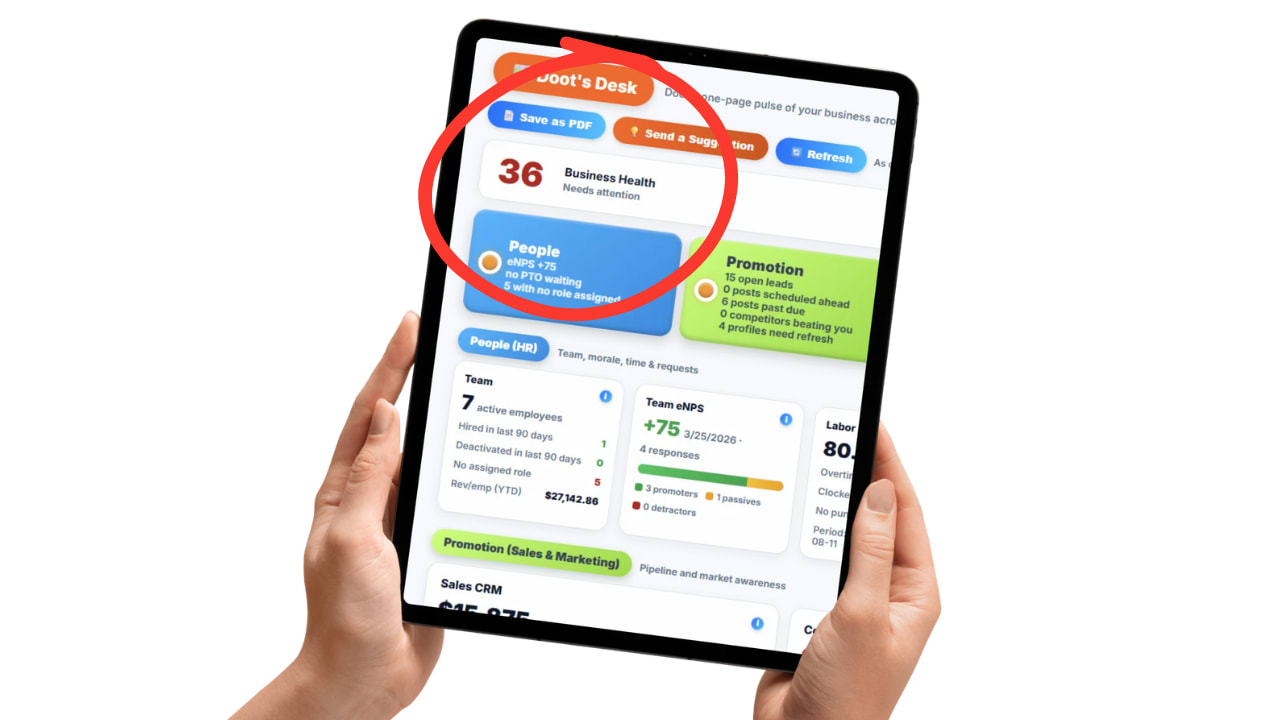
Underneath the five levers is a single business health score on a 0 to 100 scale. It rolls up how the whole operation is performing, so you get one honest read instead of five separate signals you have to weigh against each other in your head.
The score is most useful watched over time. One reading tells you where you stand today, but the movement week to week tells you whether the changes you made actually worked, which is a much harder question to answer from memory or from one good month in a single department.
You can also attach goals directly to the metrics feeding it. Set the target you're aiming for and the metric stops being a number you interpret, becoming progress against something specific, which is what drives both the color on the lever above it and the score itself. Without a target, a number is just information. With one, every metric answers whether you're on track or behind.
No setup project, no consultant and no IT department. You already generate the data by running your business in Updoot. Doot's Desk gathers it from every tool, scores each of the five levers, and shows you the one that needs attention today.
Sign up with your email or Google. You get 14 days free with every feature, and no credit card is needed.
Import your users, add them yourself, or send the list to our support team and we will load your employees for you. Employees you add with an email get an invite automatically.
Hours, projects, invoices, tickets, goals, and hiring all happen in Updoot the way they already do.
Every tool feeds the dashboard automatically. No exports, no spreadsheets, no report building on a Friday afternoon.
Each lever shows green, yellow, or red, and a single health score rolls it all up so your attention goes where it's needed.
Updoot runs right in the phone's browser and is designed to look and work just like an app, without the headache of downloads. No app store, no installs, no updates to chase and no storage space used. Employees open the link, log in and they are ready.
Everything needed to see how the business is actually doing, without building a single report.
People, Promotion, Process, Performance, and Product on one screen.
Green, yellow, or red tells you where to look first.
Reflects the work happening now, not last month's snapshot.
Pulled from every tool automatically with no setup required.
Nothing to export, merge, or rebuild every month.
Catch a lever slipping while it's still cheap to fix.
See trade-offs between levers instead of one metric in isolation.
Answers where your attention goes today, fast enough to actually use.
One roll-up number for how the whole operation is performing.
Attach a target so each metric shows progress, not just a number.
Watch the score move to see whether your changes actually worked.
The view a COO would build, without hiring one.
You get the whole system, not just this feature. Here are a few of the 30+ tools included, with no tiers and no add-ons.
Plus invoicing, payroll reports, meetings, goals, budgeting, roles and more.
Short, practical reads on job costing, field operations, and running a tighter operation.
Stop assembling the picture by hand every month. Start your free trial of Updoot -- Doot's Desk shows all five levers live, flagged green, yellow, or red, with no setup and no report building.
Start Free Today →