
CEO Dashboard Software: What to Look For and How It Works
A CEO's job is to make a small number of high-stakes decisions well, and to make them early enough to matter. That is hard to do when the information needed to make them is scattered across an accounting tool, a CRM, a project board, and three people's inboxes. By the time someone assembles it into a report, the moment to act has often passed. CEO dashboard software exists to close that gap: it puts the handful of company-level numbers that actually describe the health of the business onto one screen, kept current, so the person at the top can see where things stand without waiting for a monthly deck. This guide covers what CEO dashboard software is, how it works, what to look for when choosing one, which metrics belong on it, the pitfalls that quietly make it useless, and a free planner to sketch your executive scorecard.
Quick Answer
CEO dashboard software pulls a company's highest-level metrics into one executive view so a CEO can see the state of the whole business at a glance instead of assembling it from separate reports. It works by connecting to the tools a company already uses, rolling their numbers up into fewer than ten company-wide metrics, and comparing each against a target with its trend. Look for automatic data connections, real-time refresh, a clean top-level view, and the ability to drill into a number when needed, and avoid letting it sprawl into operational detail or run on stale data.
What CEO Dashboard Software Is
CEO dashboard software is a tool designed to give a company's leader a fast, accurate read on overall performance. Where an analyst's dashboard might slice revenue a dozen ways, a CEO dashboard deliberately stays high. It shows a curated set of company-wide metrics, each with a target and a trend, arranged so the whole picture reads in under a minute. The design goal is not depth of analysis but speed of understanding, so the CEO can spot what needs attention and delegate the digging.
It differs from a general business intelligence platform in purpose. BI tools are built for exploration and can answer almost any question if someone configures them to, which makes them powerful and often heavy to maintain. CEO dashboard software answers one question well: is the business on track, and if not, where. For many small and mid-sized companies, that focus makes it faster to stand up and far easier to keep current than a full BI deployment that needs an analyst to feed it.
How CEO Dashboard Software Works
Under the hood, a CEO dashboard is a data pipeline with a disciplined front end. The moving parts are straightforward once you see them laid out.
It connects to source systems. The dashboard pulls numbers from the tools a company already runs on, such as accounting software for cash and revenue, a CRM for pipeline, and project or time-tracking tools for delivery and capacity. The stronger the connections, the less anyone has to key numbers in by hand.
It rolls detail up into company-level metrics. Raw data from each system is aggregated into a small set of top-level figures. Hundreds of individual invoices become one revenue number; dozens of open deals become one pipeline value. The rollup is what turns operational data into an executive view.
It compares each metric to a target. A number on its own means little, so each metric is shown against a goal and its recent trend, usually with a status color. That context is what lets a CEO glance at the screen and know immediately whether a figure is fine or needs a conversation.
It refreshes on a cadence. The dashboard updates on a set rhythm, from live for operational figures to daily or weekly for slower-moving ones, so the view always reflects the current state rather than last month's snapshot.
It allows a controlled drill-down. When a top-level number looks wrong, good software lets the CEO click into the next layer of detail or hand the question to the owner of that metric, without cluttering the main view with that detail by default.
What to Look For in CEO Dashboard Software
Automatic data connections. The single biggest factor in whether a dashboard survives is how the data gets in. If updating it means someone exporting spreadsheets every week, it will fall out of date fast. Prioritize software that connects directly to the systems you already use.
A genuinely top-level default view. The software should make it easy to keep the main screen at company level and resist the temptation to pile on detail. A CEO view that shows forty metrics is not a CEO view.
Targets and trends built in. Every metric needs a target and a direction to be readable at a glance. If the tool only shows raw current values, it is a data display, not a decision aid.
Real-time or near-real-time refresh. Stale numbers erode trust quickly. Confirm how often data updates and whether that cadence matches how fast each metric actually moves.
Drill-down when needed. The ability to click from a company-level number into the detail behind it, or route it to an owner, keeps the top view clean while still answering the follow-up question.
Clear metric ownership. Software that lets you assign an owner to each metric turns an off-track number into a task instead of a shrug, which is what makes a dashboard drive action rather than just describe the past.
Sensible setup effort. For a company without a dedicated analyst, time-to-value matters. A tool you can stand up in a day and refine over weeks beats a powerful platform that needs a month of configuration before it shows anything useful.
Access control. A CEO dashboard often contains sensitive figures like cash and margin. Being able to control who sees the full view versus a department-level slice matters as the team grows.
Metrics That Belong on a CEO Dashboard
The discipline of a CEO dashboard is staying at the company level. Every metric should describe the health of the whole business, not the detail of one function. A practical filter is to ask whether a number would change a decision the CEO personally makes; if it belongs to a manager two levels down, it belongs on their dashboard, not this one.
Revenue and Growth
The headline number, whether monthly recurring revenue, bookings, or period revenue, shown against target and prior period so growth, flat, or decline is obvious at a glance.
Cash and Profitability
Cash on hand, runway, and a margin measure keep the dashboard honest about whether growth is sustainable. Cash problems are visible for months before they become a crisis, and this is where they show up first.
Pipeline or Leading Indicator
Revenue reflects decisions already made. A pipeline value or qualified lead count gives an early read on the next quarter while there is still time to influence it.
Operational Delivery
One or two metrics that show whether the core work is getting done on time and to standard, such as on-time delivery, throughput, or open project count. This is where sales promises are kept or quietly broken.
People and Capacity
Headcount, utilization, and an engagement signal such as an eNPS score. Capacity is often the real ceiling on a small company's growth, and an overloaded team shows up here long before it shows up in revenue.
Customer Health
Retention, churn, or a satisfaction score. Customers usually disengage well before they formally leave, so a customer-health number is an early warning system for future revenue.
Build Your Executive Scorecard
Use the tool below to draft the metrics for your CEO dashboard before you build or buy one. Give each metric an owner and a target so the scorecard is ready to hand off.
Executive Scorecard Planner
Add each company-level metric with its target, current value, and owner. Print it or copy it as text to hand off to whoever builds the dashboard.
Scorecard Details
Metrics
Common Pitfalls to Avoid
Letting It Drift Into Operational Detail
The most common failure is scope creep. A metric gets added, then another, until the CEO view is a dense operational report that the person at the top stops reading. Guard the top level ruthlessly; detail belongs on the dashboards of the people who own it, with a drill-down path from the executive view when needed.
Running on Stale Data
A dashboard is only as trustworthy as its last update. If the numbers are a week old and everyone knows it, executives quietly stop relying on it and go back to asking their teams directly, which defeats the entire purpose. Automate the data connections so the view stays current without anyone remembering to refresh it.
Measuring What Is Easy Instead of What Matters
Some numbers are simple to pull but do not drive any decision, while the ones that actually matter are harder to get. Dashboards drift toward the easy metrics and end up busy but hollow. If a number would not change what the CEO does when it moves, it does not belong on the screen.
No Targets, No Context
A screen of raw current values is a data display, not a decision tool. Without a target and a trend, a CEO cannot tell whether a number is good or bad, and the dashboard becomes wallpaper. Every metric needs a goal and a direction.
Building It and Never Revisiting It
The first version of any dashboard is a guess about what matters, and some of those guesses will be wrong. Companies that never revisit the dashboard keep staring at metrics that stopped being relevant while the number they now need is nowhere on it. Review the dashboard itself each quarter and prune.
Over-Buying the Platform
A small company does not need an enterprise BI suite with a six-figure implementation to see whether it is on track. Matching the tool to the actual size and complexity of the business saves money and, more importantly, gets a working dashboard live in days instead of months.
Where Updoot Fits In
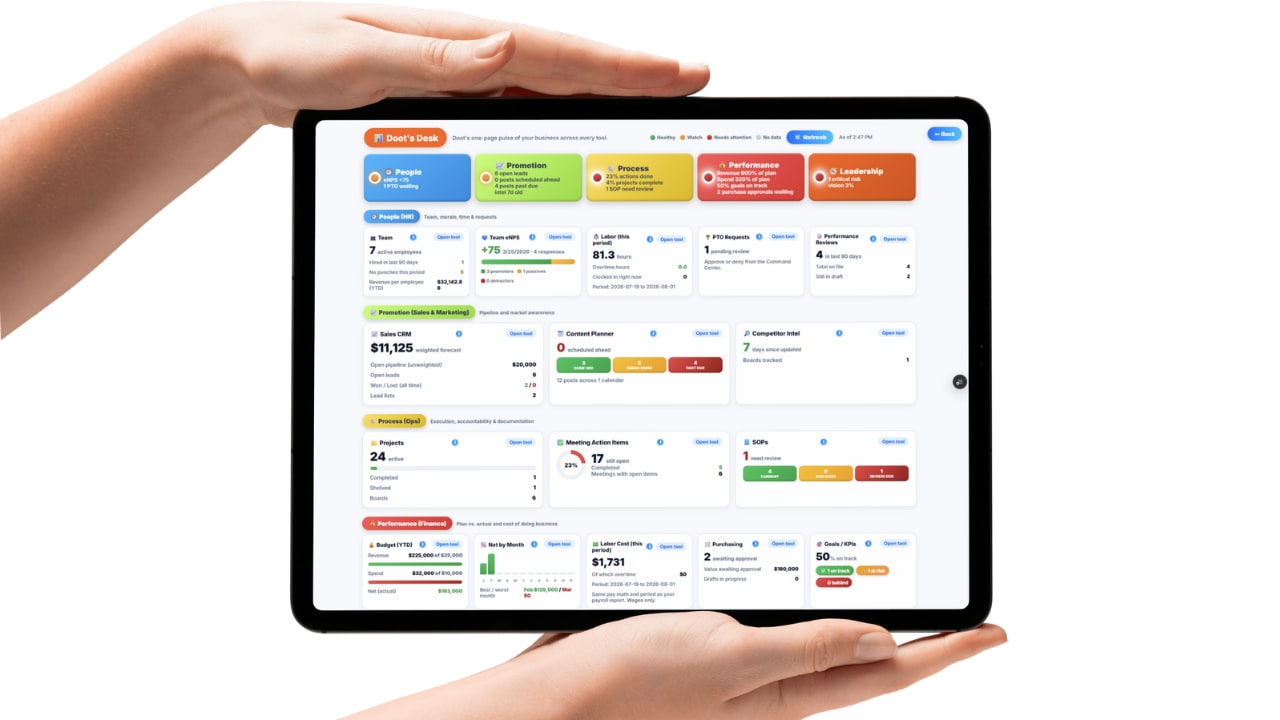
Updoot's business health dashboard, Doot's Desk, is built to be exactly this kind of executive view for small businesses, pulling the company-level numbers that already live across the platform into one screen instead of asking a CEO to assemble them by hand. Because time tracking, payroll, projects, meetings, performance reviews, and goals all live inside the same platform, the dashboard reflects real activity rather than figures someone has to re-enter, so capacity, delivery, and people metrics stay current on their own. It sits alongside the rest of Updoot's work management tools, which means a metric drifting off target on the dashboard connects directly to the projects, meetings, and owners that can act on it, closing the gap between a CEO noticing a problem and someone doing something about it. For a leader running a small company without a dedicated analyst, that combination of an always-current company health view and the tools to act on it in the same place is what turns a dashboard into something used every morning rather than built once and forgotten.
Frequently Asked Questions
CEO dashboard software is a tool that pulls the highest-level metrics about a company's performance into a single executive view, so a CEO can see the state of the whole business at a glance rather than assembling it from separate departmental reports. It focuses on a small set of company-wide numbers across finance, sales, operations, and people, each shown with a target and a trend, and it is built for fast reading rather than deep analysis.
A CEO dashboard connects to or receives data from the systems a company already uses, such as accounting software, a CRM, and project or time-tracking tools, then rolls those numbers up into a handful of top-level metrics. Each metric is compared against a target and shown with its trend and often a status color, so an off-track number stands out immediately. The dashboard refreshes on a set cadence so the view always reflects the current state of the business.
A CEO dashboard should stay at the company level: revenue and growth, cash position and runway, a profitability measure such as gross margin, a pipeline or leading sales indicator, one or two operational metrics tied to delivery, a people or capacity metric, and a customer retention or satisfaction number. The goal is a complete picture of company health in under ten metrics, not a detailed operational report.
Business intelligence tools are built for deep analysis and let analysts slice data in many directions, which makes them powerful but often complex to set up and maintain. CEO dashboard software is built for a single purpose: showing a curated executive view that answers whether the business is on track. For many small and mid-sized companies a focused dashboard is faster to stand up and easier to keep current than a full BI platform.
The biggest pitfall is letting the dashboard drift down into operational detail until it stops being an executive view and becomes a report nobody at the top actually reads. The second is stale data: if the numbers are not current, executives quietly stop trusting the dashboard and go back to asking their teams directly, which defeats the purpose of having it.
Final Thoughts
CEO dashboard software earns its place the first time it surfaces a problem early enough to fix, when cash tightens a month before it would have become a crisis or the team runs over capacity while revenue still looks fine. The value is not in the charts but in the discipline of choosing the few company-level numbers that describe the health of the business and keeping them current enough to act on. Prioritize automatic data connections and a genuinely top-level view over feature lists, give every metric a target and an owner, keep the data fresh, and revisit the dashboard itself as the business changes. Do that, and it stops being a report someone produces for you and becomes the first screen you check, which is exactly what a good one should be.