
Business Dashboard: What to Put On One and How to Build It
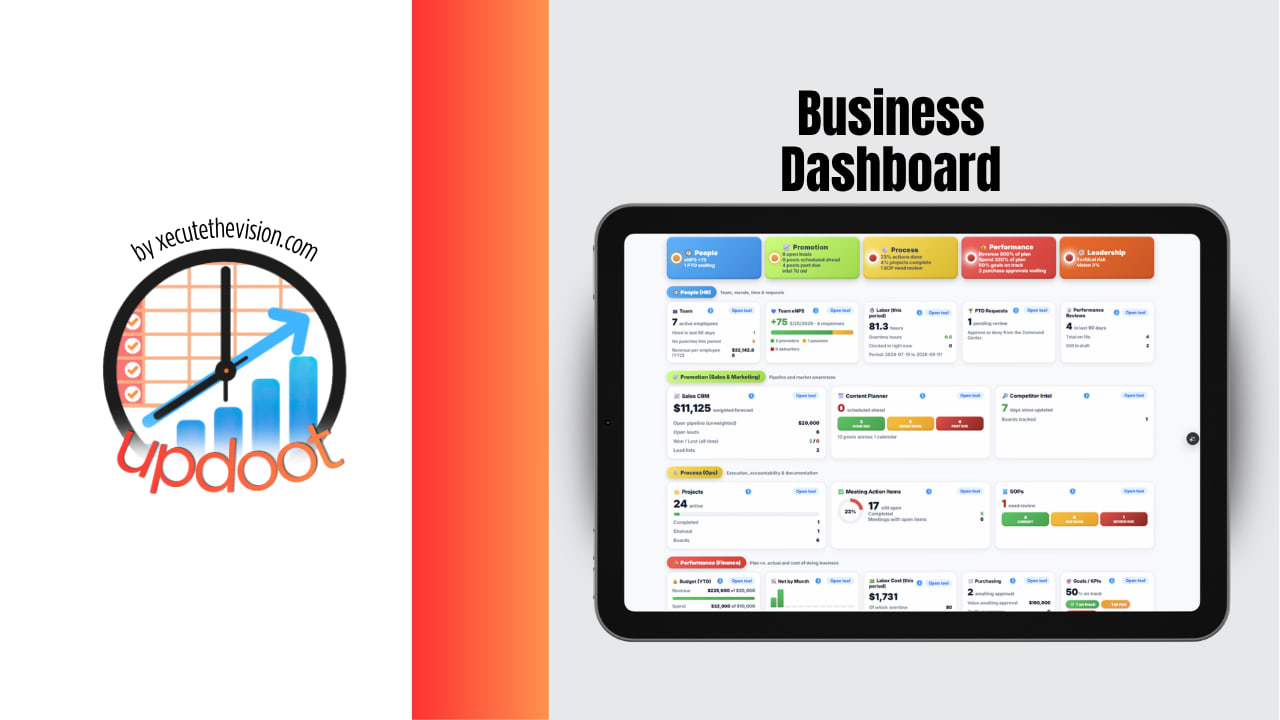
Most small businesses do not lack data. They lack a single place to see it. Sales numbers live in one tool, cash sits in the bank feed or accounting software, project status is buried in someone's head, and the team's workload is a guess until something slips. A business dashboard fixes that gap by pulling the handful of numbers that actually describe the health of the company onto one screen, so an owner can glance at it in the morning and know whether things are on track without opening six tabs. The hard part is not the software. It is deciding which numbers earn a spot and which ones are just noise dressed up as insight. This guide covers what a business dashboard is, what belongs on one, how to build it, which areas of the business to focus on, the pitfalls that quietly make dashboards useless, and a free planner to sketch yours.
Quick Answer
A business dashboard is a single screen that shows the most important metrics about how a business is performing, so decisions can be made at a glance instead of hunting through separate reports. A good one tracks five to ten metrics across sales, finance, operations, and people, each with a target and a trend for context. Build it by deciding what questions it must answer, picking the smallest set of metrics that answer them, setting targets and a refresh cadence, and cutting anything nobody looks at after a few weeks.
What a Business Dashboard Actually Is
A business dashboard is a summary view of company performance, designed to be read quickly. Instead of a stack of monthly reports, it surfaces a curated set of key metrics and shows each one with enough context to be meaningful: the current value, the target, the direction it is trending, and often a simple status color so problems stand out. The point is not to display everything the business measures. It is to answer, in under a minute, the question every owner asks constantly, which is whether the business is doing better or worse than it should be right now.
There are a few common flavors. An executive or company health dashboard rolls up the whole business into a top-level view. A departmental dashboard zooms into one function, such as a sales pipeline or a support queue. An operational dashboard tracks live activity that changes hour to hour. Most small businesses start with a single company-health view and only add departmental ones once a specific team has enough moving parts to justify its own screen.
What Should Be On a Business Dashboard
The strongest dashboards are ruthless about what they include. Every metric on the screen competes for attention, and a number that never changes a decision is actively harmful because it dilutes the ones that do. A useful filter is to ask, for each candidate metric, "if this went the wrong way, would I do something about it?" If the answer is no, it belongs in a report, not on the dashboard.
A revenue or sales metric. Almost every dashboard leads with money coming in, whether that is monthly recurring revenue, bookings, or sales for the period. This is the number that tells you the business is growing, flat, or shrinking.
A cash or profitability metric. Revenue alone hides problems. Cash on hand, runway, or gross margin keeps the dashboard honest about whether growth is actually sustainable or just busy.
A pipeline or leading indicator. Revenue is a lagging number that reflects decisions made weeks ago. A pipeline value, qualified lead count, or booked-work backlog gives an early read on what next month looks like while there is still time to act.
One or two operational metrics. These tie to how the business actually delivers: on-time delivery rate, open project count, average resolution time, production output, or whatever measures the core work getting done.
A people or capacity metric. Utilization, headcount, open roles, or a simple engagement measure. Capacity is often the real constraint on a small business, and it is the number owners most often forget to watch until someone burns out.
A customer metric. Retention, churn, repeat rate, or a satisfaction score. Keeping existing customers is almost always cheaper than winning new ones, so a customer-health number earns its place.
Each of these should carry a target and a trend, not just a raw figure. "Revenue: 42,000" tells you almost nothing on its own. "Revenue: 42,000, target 45,000, down 6% from last month" tells you exactly where to look. Context is what turns a number into a decision.
Areas of the Business to Focus On
A balanced dashboard covers the whole business rather than over-indexing on the one area that is easiest to measure. Sales metrics are usually the most available, which is exactly why dashboards drift toward becoming sales reports and go blind to everything else. The areas below give a checklist for coverage.
Sales and Marketing
Lead volume, conversion rate, pipeline value, and cost to acquire a customer. This area answers whether the top of the funnel is healthy and whether the business is spending efficiently to fill it.
Finance and Cash
Cash position, runway, gross margin, and outstanding receivables. Finance is the area a struggling business notices last and should have noticed first, because cash problems are usually visible for months before they become a crisis.
Operations and Delivery
Whatever measures the core work getting done on time and to standard: project status, throughput, error or rework rate, and cycle time. This is where promises made in sales either get kept or quietly broken.
People and Capacity
Headcount, utilization, time-off coverage, and an engagement or morale signal such as an eNPS score. For a service business especially, capacity is the ceiling on everything else, and an overloaded team shows up here long before it shows up in revenue.
Customers
Retention, churn, repeat purchase rate, and satisfaction. This area is the early warning system for revenue, because customers usually disengage well before they formally leave.
How to Create a Business Dashboard
Building a dashboard is less a design task than a decision task. The layout is easy once the thinking is done. The order below keeps it from ballooning into an unreadable wall of numbers.
1. Decide the questions first. Write down the one or two questions the dashboard exists to answer, such as "are we hitting our revenue and cash targets this month" and "is the team over capacity." Every metric earns its place by helping answer one of those questions.
2. Pick the smallest set of metrics. Choose five to ten metrics total, spread across the areas above. If you catch yourself adding a number because it is available rather than because it answers a question, cut it.
3. Find where each number already lives. For every metric, note the source: accounting software, CRM, project tool, time tracker. Prefer numbers you can pull automatically or update in seconds, because a metric that takes an hour to refresh will quietly stop getting updated.
4. Set a target and a cadence for each. Assign every metric a target and decide how often it refreshes, whether daily, weekly, or monthly. A number without a target is just trivia, and a number without a refresh rhythm goes stale.
5. Lay it out by importance. Put the metrics that drive the biggest decisions at the top left, where the eye lands first. Group related metrics together, and use simple status colors so an off-track number is visible without reading the figure.
6. Ship a rough version and use it. Build a basic version in a spreadsheet or a dedicated tool, then live with it for a few weeks. Watch which numbers you actually check and which you skip. Cut the ones nobody looks at and add anything you keep wishing were there. A dashboard is a living thing, not a one-time build.
Build Your Dashboard Metric Plan
Use the tool below to draft the metrics for your dashboard before building it. Give each one an owner, a target, and where the number comes from, then print it or copy it as text to hand off.
Dashboard Metric Planner
Add each metric with its target, current value, and owner. Print it or copy it as text to hand off to whoever builds the dashboard.
Dashboard Details
Metrics
Common Pitfalls to Avoid
Putting Too Many Metrics On It
The fastest way to kill a dashboard is to cram thirty numbers onto it. When everything is highlighted, nothing is, and the screen becomes a report nobody reads. Discipline about cutting metrics is what separates a dashboard people check daily from one they open once and abandon.
Measuring What Is Easy Instead of What Matters
Some numbers are simple to pull but do not change any decision, while the numbers that actually drive the business are harder to get. Dashboards drift toward the easy ones, ending up busy but useless. If a metric would not change what anyone does when it moves, it does not belong on the screen.
Numbers Without Context
A figure on its own is nearly meaningless. Is 42,000 in revenue good or bad? Without a target and a trend, no one can tell, and the dashboard becomes a wall of numbers people learn to ignore. Every metric needs a target and a direction to be readable at a glance.
Letting It Go Stale
A dashboard is only as trustworthy as its last update. If the numbers are a week old and everyone knows it, the team stops relying on it and goes back to asking around, which defeats the point. Automate the refresh where possible, and if a metric can only be updated manually, keep it simple enough that updating it is a two-minute job.
Building It and Never Revisiting It
The first version of a dashboard is a guess about what matters. Some of those guesses will be wrong. Teams that never revisit the dashboard keep staring at metrics that stopped being relevant months ago while the number they actually need is nowhere on the screen. Review the dashboard itself every quarter and prune.
No Owner for Off-Track Numbers
A red metric that belongs to nobody stays red. When each number has a clear owner, an off-track figure becomes a task instead of a shrug, and the dashboard turns into something that drives action rather than just describing the past.
Where Updoot Fits In
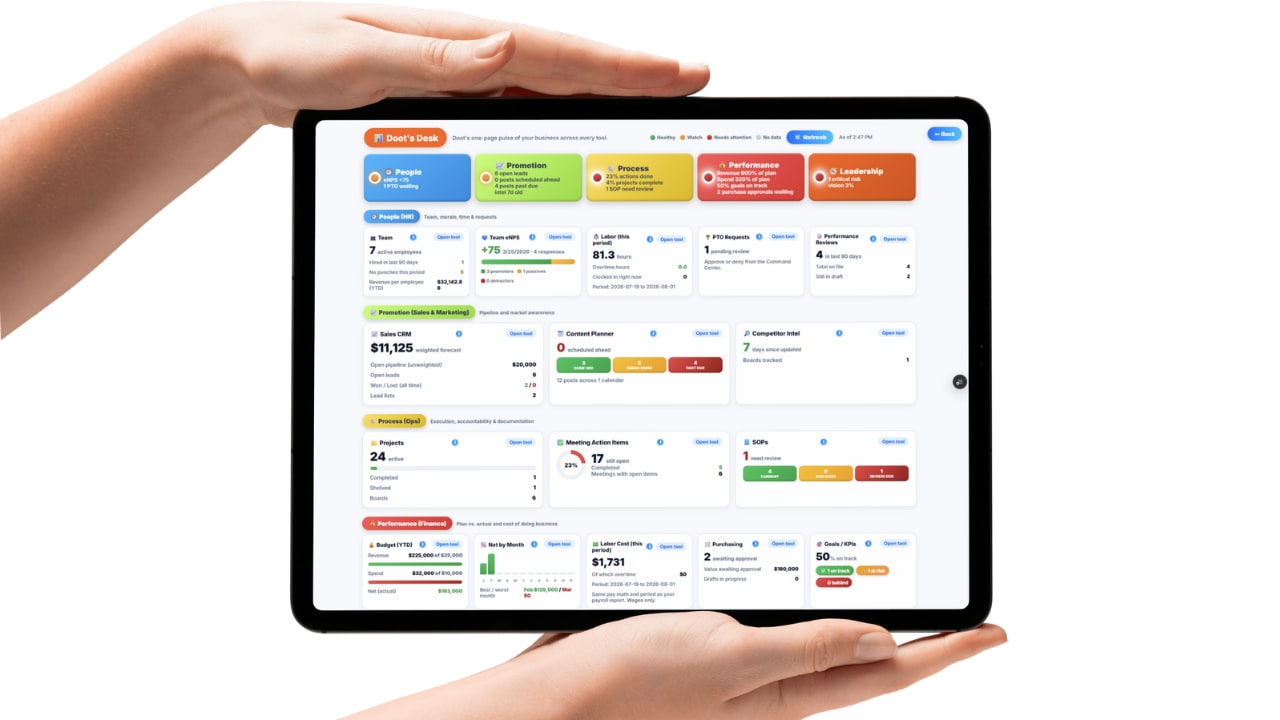
Updoot's new business health dashboard, Doot's Desk, is built to be exactly this kind of single-screen view for small businesses, pulling the numbers that already live across the platform into one place instead of asking owners to assemble them by hand. Because time tracking, payroll, projects, meetings, performance reviews, and goals all live inside the same platform, the dashboard reflects real activity rather than figures someone has to re-enter, so capacity, delivery, and people metrics stay current on their own. It sits alongside the rest of Updoot's work management tools, which means a metric drifting off target on the dashboard connects directly to the projects, meetings, and owners that can do something about it, closing the gap between noticing a problem and acting on it. For a small team without a dedicated analyst, that combination of an always-current company health view and the tools to act on it in the same place is what makes a dashboard something people actually use rather than build once and forget.
Frequently Asked Questions
A business dashboard is a single screen that pulls the most important numbers about how a business is performing into one place, so owners and managers can see the current state of the company at a glance instead of hunting through separate reports. It typically tracks a small set of key metrics across sales, finance, operations, and people, updated regularly and presented visually with charts, trends, and status indicators.
A good business dashboard focuses on a handful of metrics that actually drive decisions rather than every number available. Most small businesses benefit from tracking revenue and cash position, a profitability measure, a pipeline or lead indicator, one or two operational metrics tied to delivery, and a people metric such as utilization or headcount. Each metric should have a target and a trend so the number has context, not just a raw figure.
Start by deciding the one or two questions the dashboard needs to answer, then pick the smallest set of metrics that answer them. Identify where each number already lives, set a target and a refresh cadence for each, and lay them out so the most important figures sit at the top. Build a simple version first in a spreadsheet or a dedicated tool, use it for a few weeks, and cut anything nobody looks at.
For most small businesses, somewhere between five and ten metrics is the practical range. Fewer than five usually misses an important area of the business, and more than ten tends to bury the numbers that matter under ones that do not. The goal is a screen someone can read in under a minute and walk away knowing whether the business is on track.
The most common mistake is putting too many metrics on the dashboard, which turns it into a report nobody reads. The second most common is tracking numbers that are easy to measure instead of the ones that actually influence decisions, so the dashboard looks busy but never changes what anyone does.
Final Thoughts
A business dashboard is worth building the first time it catches a problem early, when cash tightens a month before it would have become a crisis, or the team quietly runs over capacity while revenue still looks fine. The value is not in the charts. It is in the discipline of choosing the few numbers that actually describe the health of the business and looking at them often enough to act while there is still time. Keep it to a handful of metrics, give every one a target and an owner, keep it current, and revisit the dashboard itself as the business changes. Do that, and the dashboard stops being a report you produce and becomes the first thing you check, which is exactly what a good one should be.