
What Is a P&L Statement and How to Create One
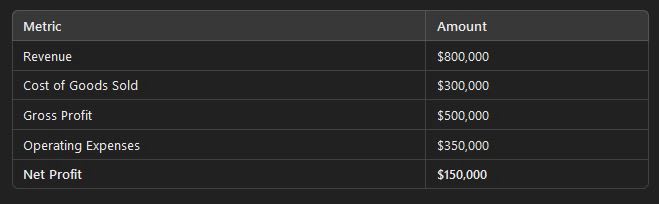
A P&L statement is the one financial report that tells you whether your business is actually making money. P&L stands for profit and loss, and you will also hear it called an income statement. All three names mean the same thing.
Plenty of owners watch revenue and assume that means things are going well. But revenue alone says nothing about health. A company can bring in a million dollars in sales and still lose money if costs grow faster.
The P&L shows you the whole picture: what came in, what went out, and what was left. Below, every line is explained in plain English, with a worked example, the ratios to watch, and a free P&L builder that pastes straight into Excel with working formulas.
What Does P&L Mean?
A P&L statement summarizes three things over a set period, usually a month, quarter, or year:
- Revenue: money earned from sales
- Expenses: the costs of earning it and running the business
- Profit or loss: what is left after expenses
The core formula is simple: Revenue minus Expenses equals Net Profit (or Loss). If revenue is higher than expenses, you made a profit. If expenses are higher, you had a loss. The real value is in the lines between the top and the bottom.
Why the P&L Matters
- It shows whether the business model works. You can see if you are profitable or just busy.
- It shows where money goes. Every expense category is visible, so waste is easier to spot.
- It drives decisions. Pricing, hiring, marketing spend, and expansion all depend on it.
- It shows trends. Comparing month to month reveals problems while they are still small.
- Lenders and investors ask for it. The U.S. Small Business Administration lists financial statements among the basics every business should keep up to date.
Every Line of a P&L Explained
| Line | What It Means | How It Is Calculated |
|---|---|---|
| Revenue (top line) | Everything you earned from selling products or services | Sum of all sales and service income |
| Cost of goods sold (COGS) | Direct costs of making the product or delivering the service: materials, production labor, freight on inventory | Sum of direct costs |
| Gross profit | What is left to run the business after direct costs | Revenue minus COGS |
| Operating expenses | Costs of running the business that are not tied to each sale: office salaries, rent, marketing, software, insurance | Sum of operating costs |
| Operating income | Profit from your core business before interest and taxes | Gross profit minus operating expenses |
| Other income and expense | Items outside normal operations, such as interest, one-time gains, or loan costs | Other income minus other expense |
| Pre-tax income | Profit before income tax | Operating income plus other income minus other expense |
| Income tax | Tax on business income, if the business pays it directly | Based on your tax situation |
| Net profit (bottom line) | What the business actually kept | Pre-tax income minus income tax |
A note on taxes: many small businesses, such as sole proprietors, partnerships, and S corporations, do not pay income tax at the business level because profit passes through to the owners. In that case the income tax line stays at zero on the business P&L. Your accountant can confirm how yours works.
A Worked P&L Example
Here is a simple P&L for a small business over one year.
| Line Item | Amount |
|---|---|
| Revenue | $100,000 |
| Cost of goods sold | $40,000 |
| Gross profit | $60,000 (60% gross margin) |
| Payroll | $25,000 |
| Rent and utilities | $10,000 |
| Marketing | $10,000 |
| Software | $5,000 |
| Total operating expenses | $50,000 |
| Operating income | $10,000 (10% operating margin) |
| Interest expense | $2,000 |
| Net profit | $8,000 (8% net margin) |
The business brought in $100,000 but kept $8,000. That gap is exactly what the P&L is designed to show.
How to Create a P&L Statement Step by Step
- Pick the period. Monthly is best for running the business. Quarterly and yearly are useful for trends and taxes.
- Choose cash or accrual. Cash basis records income and expenses when money moves. Accrual records them when they are earned or incurred. The IRS explains both in Publication 538. Stay consistent from period to period.
- Total your revenue. Pull sales from invoices, your point-of-sale system, or bank deposits.
- Separate direct costs from operating costs. Anything you would not spend if you made no sales usually belongs in COGS.
- Group operating expenses into a few categories. Payroll, rent, marketing, software, insurance, and other is plenty for most small businesses.
- Add other income and expense. Interest, one-time gains, and loan costs go here.
- Calculate each subtotal and your margins. The free builder below does this for you.
Good records make every step easier. The IRS guide Publication 583 covers what business records to keep.
P&L for Service Businesses vs. Product Businesses
The structure is the same for every business, but what lands in each line depends on what you sell.
| Line | Product Business | Service Business |
|---|---|---|
| Revenue | Product sales, shipping charged to customers | Hourly billing, project fees, retainers |
| Cost of goods sold | Materials, inventory, production labor, inbound freight | Wages of the people doing billable work, subcontractors, job materials |
| Operating expenses | Store or office rent, sales and admin staff, marketing | Office rent, admin staff, software, marketing |
| Biggest lever | Pricing and supplier costs | Billable utilization and rates |
For service businesses, the hours your team spends on client work are the cost of goods sold. That is why tracking time by client and project is so useful: it shows you which work is actually profitable.
Free P&L Statement Builder
Free P&L Statement Builder
Type your numbers for any period, such as a month or a quarter. The builder totals each section and calculates your margins. Copy to Excel pastes the full statement with live formulas, so the totals keep working in your spreadsheet. The example numbers match the worked example in this article. Nothing you enter is saved or sent anywhere.
| Line Item | Amount ($) |
|---|---|
| Product sales | |
| Service revenue | |
| Other revenue | |
| Total Revenue | 0 |
| Cost of goods sold (COGS) | |
| Gross Profit | 0 |
| Gross Margin | 0 |
| Payroll (non-production staff) | |
| Rent and utilities | |
| Marketing | |
| Software | |
| Insurance | |
| Other operating expenses | |
| Total Operating Expenses | 0 |
| Operating Income | 0 |
| Interest and other income | |
| Interest and other expense | |
| Pre-Tax Income | 0 |
| Income tax | |
| Net Profit | 0 |
| Net Margin | 0 |
Key P&L Ratios to Watch
| Ratio | Formula | What It Tells You |
|---|---|---|
| Gross margin | Gross profit divided by revenue | Whether your pricing covers your direct costs with room to spare |
| Operating margin | Operating income divided by revenue | How efficiently the whole business runs |
| Net margin | Net profit divided by revenue | How much of each sales dollar you keep |
| Operating expense ratio | Operating expenses divided by revenue | Whether overhead is growing faster than sales |
For more formulas like these, see our business math formulas cheat sheet.
Common P&L Mistakes
- Confusing revenue with profit. Revenue is what you collect, not what you keep.
- Missing small recurring costs. Subscriptions, card fees, and small contractor bills add up.
- Reviewing it once a year. By then it is too late to fix anything.
- Assuming profit equals cash. Unpaid invoices and loan payments mean profit and bank balance can be very different.
- Mixing personal and business spending. It makes the P&L wrong and creates tax headaches.
How to Read a P&L Like an Operator
Ask four questions every month. Is revenue growing, flat, or falling? Is gross margin stable, or are direct costs creeping up? Are operating expenses growing faster than revenue? And what share of each sales dollar are you keeping? A healthy business shows steady revenue, stable or improving margins, controlled expenses, and predictable trends. A weak one shows rising revenue with shrinking profit, which usually means growth is costing more than it earns.
Using Your P&L to Make Decisions
| If the P&L Shows | Consider |
|---|---|
| Thin gross margin | Raising prices or lowering direct costs |
| Operating expenses rising faster than revenue | Pausing hires and cutting unused software |
| Marketing spend up, revenue flat | Checking customer acquisition cost by channel |
| Stable, healthy margins for several months | Expansion with less risk |
P&L vs. Balance Sheet vs. Cash Flow Statement
| Statement | What It Shows | Time Frame |
|---|---|---|
| P&L (income statement) | Profit or loss | Over a period |
| Balance sheet | What the business owns and owes | At a single point in time |
| Cash flow statement | Cash moving in and out | Over a period |
You need all three for a complete picture. Read more in understanding the differences between financial statements.
Connect Your P&L to Day-to-Day Work
Payroll is usually the biggest line on a small business P&L, and it is hard to manage when hours, projects, and invoices live in different places. Updoot is business management software that connects time tracking, projects, invoicing, and budgeting in one system, so you can see labor cost by project and compare budget to actual. Every tool exports to Excel. Plans start at $5 per user per month.
Final Thoughts
The P&L is not just an accounting document. It is how you find out whether your business works. Build one every month, compare it with the month before, and watch your margins as closely as your revenue. Once you read it regularly, you stop reacting to surprises and start making decisions with real numbers.
Opens in Google Drive. View and download for free.
Related Reading
Understanding the Differences Between Financial Statements →
Frequently Asked Questions About P&L Statements
What does P&L stand for?
P&L stands for profit and loss. A P&L statement, also called an income statement, shows revenue, expenses, and the resulting profit or loss over a set period such as a month, quarter, or year.
What is the difference between revenue and profit?
Revenue is the total money earned from sales before any expenses. Profit is what is left after expenses are subtracted. A business can have high revenue and still lose money.
What is the difference between gross profit and net profit?
Gross profit is revenue minus the direct cost of goods sold. Net profit is what remains after all expenses, including operating costs, interest, and taxes. Gross profit tests your pricing, and net profit tests the whole business.
How often should a small business create a P&L?
Monthly. A monthly P&L lets you spot rising costs or shrinking margins while there is still time to fix them. Quarterly and yearly versions are useful for trends and taxes.
Is profit the same as cash?
No. Profit is based on revenue and expenses for a period, while cash depends on when money actually moves. Unpaid invoices, inventory purchases, and loan payments can make profit and cash very different.
What is the difference between a P&L and a balance sheet?
A P&L shows profit or loss over a period of time. A balance sheet shows what the business owns and owes at a single point in time.