
How to Create a KPI Tracker in Excel
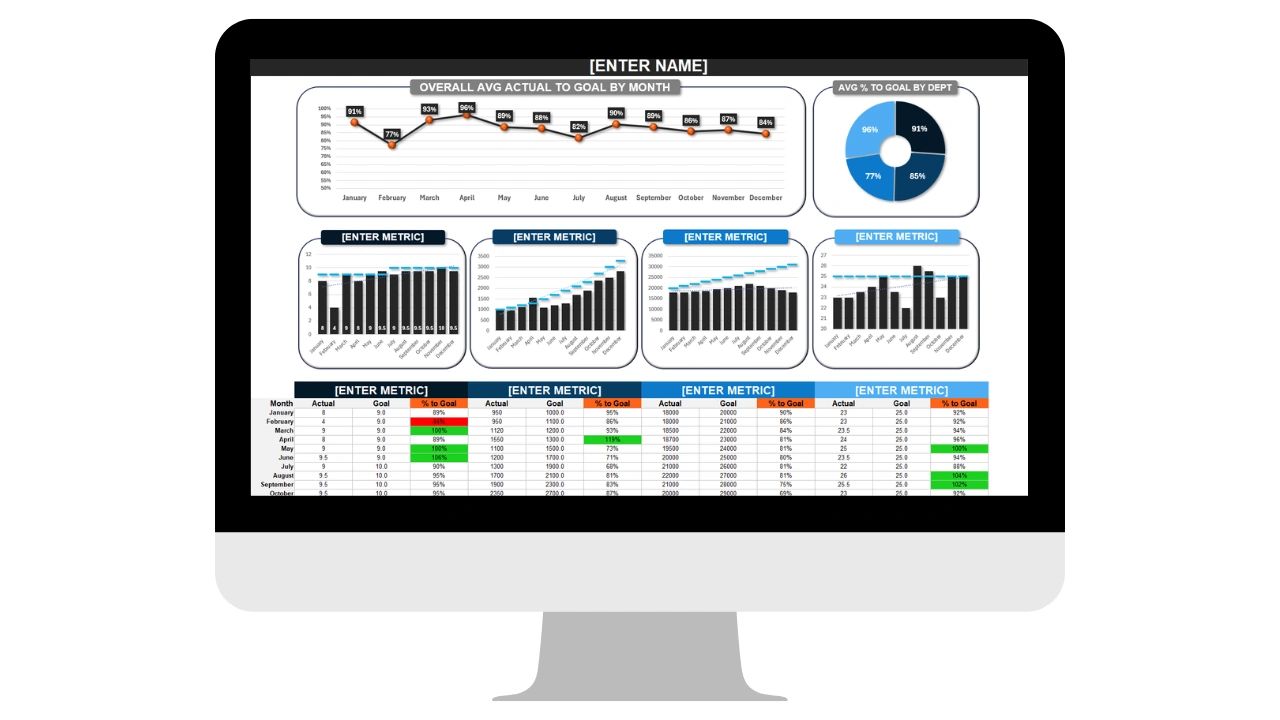
If you’re trying to figure out how to create a KPI tracker in Excel, you’re already ahead of most business owners.
Because most companies don’t fail from lack of effort.
They fail from lack of visibility.
A KPI tracker turns guesswork into data. It shows you whether you’re moving forward or just busy.
This guide will walk you through:
- What a KPI is (and what it is not)
- How to structure a KPI tracker in Excel
- What metrics you should include
- How often to update it
- Common mistakes to avoid
- When to move beyond spreadsheets
Let’s start with the foundation.
What Is a KPI?
KPI stands for Key Performance Indicator.
It is a measurable value that shows how effectively a business is achieving a specific objective.
The important word is key.
Not every metric is a KPI.
A KPI is tied directly to a business outcome.
For example:
Not a KPI:
- Number of Instagram followers
Likely a KPI:
- Revenue
- Gross margin
- Customer acquisition cost (CAC)
- Customer retention rate
- Conversion rate
- Average order value
- Labor cost percentage
KPIs measure performance against goals.
They help answer:
Are we on track? Where are we underperforming? What needs attention this week?
Why Track KPIs in Excel?
Excel remains one of the most powerful and accessible tools for business tracking.
It allows you to:
- Build custom dashboards
- Automate calculations
- Visualize trends
- Compare actual vs goal
- Track performance over time
For startups and small businesses, Excel is often the starting point before investing in full analytics platforms.
The key is building it correctly.
Step 1: Define Your KPIs Before You Open Excel
Do not start with formulas.
Start with clarity.
Ask:
What outcome am I trying to improve?
Most businesses need KPIs in 5 core areas:
- Revenue
- Sales performance
- Marketing effectiveness
- Operations
- Financial health
Example KPI list:
Revenue KPIs
- Monthly revenue
- Revenue growth rate
- Average transaction value
Sales KPIs
- Leads generated
- Conversion rate
- Close rate
- Sales cycle length
Marketing KPIs
- Cost per lead
- Cost per acquisition
- Website traffic to lead conversion
Operations KPIs
- Labor cost %
- Productivity per employee
- On-time completion rate
Financial KPIs
- Gross margin
- Net profit margin
- Cash runway
Keep it focused.
5–15 KPIs is usually enough.
If you track 40 metrics, you track none.
Step 2: Structure Your KPI Tracker in Excel
Now open Excel.
Your spreadsheet should include these core columns:
Column 1: KPI Name Column 2: Category Column 3: Goal / Target Column 4: Actual Column 5: Variance Column 6: Percentage of Goal Column 7: Status Indicator Column 8: Notes
Example layout:
| KPI | Goal | Actual | Variance | % of Goal | Status |
You can calculate:
Variance: = Actual - Goal
Percentage of Goal: = Actual / Goal
Then use conditional formatting to color-code:
- Green if above 100%
- Yellow if 90–99%
- Red if below 90%
This visual clarity makes your tracker useful.
Step 3: Add Time Tracking
A KPI tracker without time comparison is incomplete.
You need to track:
- Weekly
- Monthly
- Quarterly
Best practice:
Create separate tabs for:
- Weekly KPIs
- Monthly KPIs
- Quarterly KPIs
Or create columns for each month across the top.
Example:
| KPI | Jan | Feb | Mar | Goal |
This allows trend analysis.
Trends matter more than single data points.
Step 4: Create a Dashboard Tab
Once your data table is built, create a separate dashboard tab.
Use:
- Bar charts
- Line graphs
- Goal comparison visuals
- Traffic-light style indicators
Your dashboard should answer:
Are we winning? Where are we losing? What needs attention?
Keep it clean. Avoid clutter. Highlight only the most important KPIs.
Step 5: Decide Update Frequency
One of the most common mistakes is unclear cadence.
Different KPIs require different frequencies.
Daily:
- Sales numbers
- Production output
Weekly:
- Leads
- Conversion rates
- Labor hours
- Revenue
Monthly:
- Profit margin
- CAC
- Retention
Quarterly:
- Growth rate
- Strategic milestones
The frequency should match the decision cycle.
If you review weekly, track weekly.
Consistency matters more than complexity.
Common Mistakes When Creating a KPI Tracker in Excel
- Tracking Too Many Metrics Focus on what drives outcomes.
- No Clear Goal Defined A KPI without a target is just data.
- Manual Data Errors Manual entry increases risk. Double-check formulas.
- No Ownership Assign someone responsible for updating the tracker.
- Not Reviewing It A KPI tracker only works if reviewed regularly.
- Ignoring Leading Indicators Track not just outcomes (revenue), but drivers (leads).
- No Alignment With Strategy KPIs should connect directly to your business goals.
Advanced Excel Features That Improve KPI Tracking
If you want to level up your KPI tracker:
Use:
- Pivot Tables for summarizing data
- Data validation drop-downs
- Named ranges
- INDEX/MATCH or XLOOKUP
- Sparklines for mini trend visuals
- Dynamic charts
- Tables (Ctrl + T) for auto-expansion
Excel can be incredibly powerful but it requires structure.
When Excel Stops Being Enough
Excel is excellent for early-stage tracking.
But as you grow, you may notice:
- Version control issues
- Multiple people editing
- Broken formulas
- Manual data imports
- No audit trail
- No team accountability layer
That’s when spreadsheets start creating friction.
If your KPI tracker lives separately from your operations, you end up updating it after the fact instead of using it to guide action.
The Difference Between Tracking KPIs and Managing KPIs
Tracking shows numbers.
Managing connects numbers to action.
A strong KPI system should:
- Assign ownership
- Connect to projects
- Tie to timelines
- Align with team responsibilities
- Trigger conversations
Excel can track. Systems manage.
Done-for-You KPI Tracker Templates
If building a KPI tracker from scratch feels overwhelming, structured templates save time.
A strong KPI template should include:
- Pre-built formulas
- Conditional formatting
- Category breakdown
- Weekly and monthly tracking tabs
- Dashboard view
- Goal vs actual automation
- Clean export formatting
Templates remove setup errors and let you focus on performance.
Move Beyond Static Spreadsheets With Updoot
If you’re serious about performance tracking, your KPIs should not live in isolation.
Updoot allows you to:
- Track KPIs in real time
- Assign accountability
- Connect metrics to projects
- Visualize progress in dashboards
- Tie KPIs to your roadmap
- Align KPIs with team workflows
- Export clean reports
And if you still prefer Excel, Updoot also includes done-for-you spreadsheet templates structured correctly from the start.
No broken formulas. No messy dashboards. No guesswork.
Whether you start in Excel or move into a full operational system, the key is this:
You cannot improve what you do not measure.
A properly built KPI tracker creates clarity. Clarity creates focus. Focus creates growth.
If you want structured KPI templates built for execution or a system that turns tracking into action Updoot gives you both.
Opens in Google Drive — view and download for free