
Lead Generation KPIs to Track (Includes a Template)
Every business wants more leads. But wanting more leads and actually building a system that generates them consistently and efficiently are two very different things. The gap between those two outcomes almost always comes down to one thing: knowing which numbers to watch.
Lead generation KPIs are the metrics that tell you whether your marketing and sales efforts are actually working. Not whether they feel like they are working, but whether they are producing the pipeline, the conversions, and the revenue your business needs to grow. This guide walks through the 10 most important lead generation KPIs, what each one tells you, how to calculate it, and a tracker template at the end you can use immediately.
What Are Lead Generation KPIs?
Lead generation KPIs are measurable values that help you evaluate how effectively your marketing and sales activities are attracting, capturing, and converting potential customers. They go beyond general performance metrics like impressions or followers and focus specifically on what is happening in your funnel: how many leads are coming in, where they are coming from, how much they are costing you, and how many of them are turning into real revenue.
The distinction matters. General marketing metrics tell you about reach and awareness. Lead generation KPIs tell you about outcomes. And outcomes are what drive business decisions.
The problem most teams run into is not a lack of data. It is too much of it. There are dozens of metrics you could track across email, paid ads, SEO, social, and your website. Tracking all of them is a full-time job that still does not tell you much because you have no way to prioritize what to act on. Track the right things, interpret them together, and act on what you find.
The 10 Lead Generation KPIs You Should Be Tracking
1. Number of Leads Generated
This is the most fundamental metric and the starting point for everything else. How many new leads did your campaigns bring in over a given period? Track this by channel, by campaign, and over time so you can spot trends and understand which efforts are driving volume.
Formula: Count every new lead captured across all channels in the reporting period.
Example: You ran three campaigns this month and captured 180 leads from organic search, 95 from paid ads, and 75 from email. Total leads generated = 350.
2. Lead Conversion Rate
Volume without conversion is just noise. Your lead conversion rate tells you what percentage of your leads are actually becoming customers. Track this metric at every stage of the funnel, not just end to end. Knowing your visitor-to-lead rate, your lead-to-MQL rate, and your MQL-to-SQL rate tells you exactly where the leaks are rather than just that a leak exists somewhere.
Formula: (Customers acquired / Total leads generated) x 100
Example: 42 customers from 350 leads = 12% conversion rate. B2B benchmark: 10 to 15 percent. Below 5 percent warrants investigation into lead quality, sales process friction, or messaging.
3. Cost Per Lead
Cost per lead tells you how much you are spending to acquire each lead. It is one of the most practically useful metrics for budget decisions because it lets you compare channels on a common currency. A channel with a low cost per lead that produces leads who never convert is not actually cheaper -- it is more expensive, because you are spending sales time on people who were never going to buy.
Formula: Total marketing spend / Total leads generated
Example: $7,000 spend / 350 leads = $20 cost per lead. Always track by channel and campaign, not just in aggregate.
4. MQL and SQL Count
A Marketing Qualified Lead is a lead that marketing has determined is worth passing to sales based on fit and behavior. A Sales Qualified Lead is a lead that sales has reviewed and accepted as a genuine opportunity. Tracking both tells you how healthy the handoff between your teams is and surfaces disconnects before they cost you pipeline.
MQL formula: Count leads that meet your agreed qualification criteria -- job title, company size, industry, behavioral signals like visiting the pricing page or downloading a key asset.
SQL formula: Count MQLs that sales reviewed and accepted as worth pursuing.
Example: 140 MQLs from 350 leads. Sales accepted 70 as SQLs.
5. MQL to SQL Conversion Rate
This metric tells you how well marketing and sales are aligned on what a good lead actually looks like. If this rate is low, it often signals a disconnect between what marketing is generating and what sales actually wants. Getting this rate up requires a shared, explicit definition of what makes a lead sales-ready -- a conversation worth having and revisiting regularly.
Formula: (SQLs / MQLs) x 100
Example: 70 SQLs / 140 MQLs = 50% MQL to SQL conversion rate.
6. Visitor to Lead Rate
Your visitor to lead rate tells you how well your website is converting traffic into actual leads. It is the bridge between your top-of-funnel awareness efforts and your lead capture performance. If this rate is low, the issue is usually one of three things: your traffic is not well targeted, your offer is not compelling enough, or there is too much friction in your lead capture process.
Formula: (Total leads / Total website visitors) x 100
Example: 350 leads / 10,000 visitors = 3.5% visitor to lead rate.
7. Lead Response Time
Speed matters more than most teams realize. The probability of successfully connecting with and converting a lead drops dramatically within the first hour after they reach out or submit a form. This KPI lives at the intersection of marketing and sales and is often overlooked in favor of flashier metrics. If your leads are sitting uncontacted for more than a day, you are leaving deals on the table regardless of how strong your top-of-funnel strategy is.
Formula: Sum of response times for all leads / Total leads contacted
Example: 10 leads contacted with response times totaling 575 minutes = 57.5 minute average lead response time.
8. Customer Acquisition Cost
Customer acquisition cost is the total amount you spend on sales and marketing to acquire a single new customer. It gives you the full picture of what growth actually costs and is essential for understanding whether your lead generation strategy is financially sustainable. Compare it against customer lifetime value to determine whether your economics actually work.
Formula: Total sales + marketing spend / New customers acquired
Example: $15,000 spend / 42 new customers = $357 customer acquisition cost.
9. Customer Lifetime Value
Customer lifetime value represents the total revenue you can expect from a customer over the course of your relationship. It is not strictly a lead generation metric but it is essential context for every lead generation decision you make. When you know your CLV, you know how much you can afford to spend to acquire a customer and still be profitable. It shifts the conversation from how do we get cheaper leads to how do we get leads that are worth more over time.
Formula: Average purchase value x Average purchase frequency x Average customer lifespan
Example: $500/month x 1 purchase/month x 24 months = $12,000 CLV.
10. Time to Conversion
How long does it take for a lead to move from first contact to closed deal? This metric helps you understand the length of your sales cycle and identify where delays are happening. If leads are consistently stalling at a particular stage, that is a signal that something needs to change -- whether that is your nurture content, your sales process, or the information you are providing at a specific touchpoint.
Formula: Sum of days from first contact to close / Total conversions in period
Example: Five deals took 10, 14, 21, 30, and 45 days. 120 / 5 = 24 day average time to conversion.
How to Use These KPIs Together
The real value of tracking lead generation KPIs is not in any single number. It is in how they interact. Volume tells you one thing. Conversion rate tells you another. Cost per lead tells you something different again. When you look at all of them together, patterns emerge that you would never see from any one metric in isolation.
A good rhythm is to review your core KPIs weekly for operational decisions and monthly for strategic ones. Weekly reviews catch problems early. Monthly reviews surface trends and inform bigger decisions about channel mix, budget allocation, and targeting. The businesses that grow consistently treat their lead generation data as a feedback loop, not a report card.
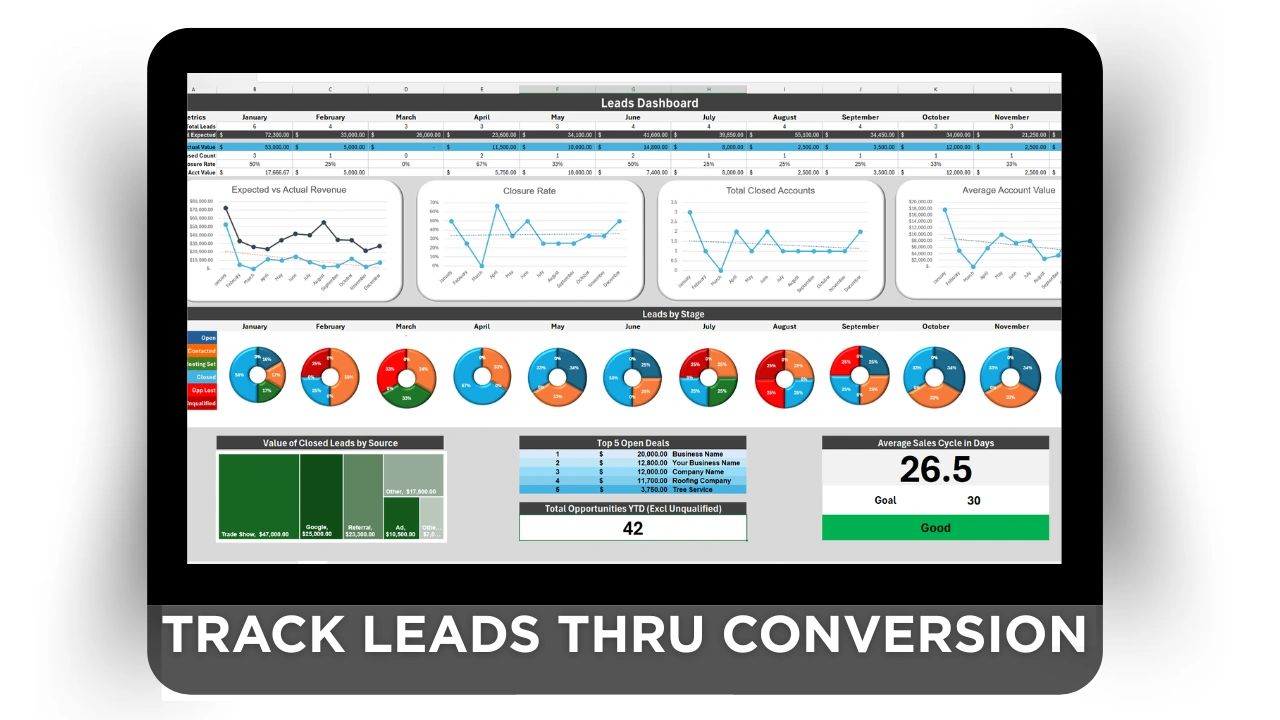
Lead Generation KPI Tracker Template
Use this tracker each month. Add a column for each channel you are running and review at the start of each period. A pre-built sales and marketing dashboard is also available in the XecuteTheVision business toolkit shop if you want a clean, structured format without building from scratch.
Lead Generation KPI Tracker
Reporting Period: __________ Team / Campaign: __________
Top Performing Channel This Period: _______________
Biggest Drop-Off Point in Funnel: _______________
Key Action for Next Period: _______________
Related Reading