
What is a P&L Statement and How to Create One
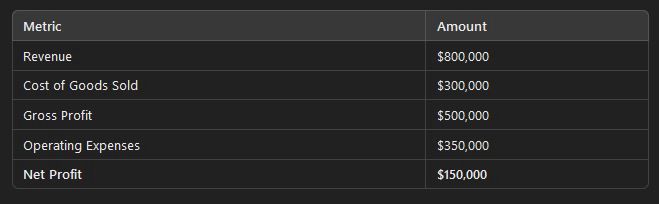
Learn how to set up and read a P&L correctly and the definitions of each item on one. If you run a business, manage a team, or are trying to understand how companies actually make money, there is one financial document you cannot ignore: the P&L statement.
You will also hear it called the income statement or profit and loss statement. All three terms refer to the same core idea: a summary of how much money a business made, how much it spent, and whether it ended up profitable or not over a specific period.
Most business owners look at revenue and assume that means success. But revenue alone does not tell you if a business is healthy. A company can bring in millions in sales and still lose money. That is exactly why the P&L statement exists.
This article breaks down what P&L means, how it works, what it includes, and how to actually use it to make smarter business decisions.
What Does P&L Mean?
P&L stands for Profit and Loss.
A P&L statement is a financial report that shows:
- Revenue (money coming in)
- Expenses (money going out)
- Profit or loss (what is left over)
In simple terms:
P&L = Revenue - Expenses = Net Profit (or Loss)
If revenue is higher than expenses, the business makes a profit. If expenses are higher than revenue, the business has a loss.
That’s the entire foundation, but the real value comes from the details inside it.
Why the P&L Statement Is So Important
A P&L statement is one of the most important tools in business because it answers one simple question:
Is this business actually making money?
But it goes deeper than that. A good P&L helps you:
1. Understand profitability
You can see if your business model works or if you are just generating revenue without profit.
2. Control spending
It shows exactly where money is going so you can cut waste.
3. Make better decisions
Hiring, pricing, marketing spend, and expansion decisions all depend on P&L clarity.
4. Track performance over time
A single month is not enough. Comparing P&Ls over time shows trends.
5. Satisfy investors or lenders
Banks and investors require P&L statements before giving funding.
Without a clear P&L, you are essentially running a business blind.
The Core Structure of a P&L Statement
Every P&L follows a similar structure. Let’s break it down step by step.
1. Revenue (Top Line)
Revenue is the total money your business earns from selling products or services.
It is often called the “top line” because it appears at the top of the P&L.
Examples:
- Sales of products
- Service income
- Subscription fees
- Consulting revenue
Important note: Revenue is NOT profit. It is just the total inflow before expenses.
2. Cost of Goods Sold (COGS)
COGS refers to the direct costs of producing your product or delivering your service.
Examples:
- Materials
- Manufacturing costs
- Direct labor
- Shipping costs tied to production
If you sell a product for $100 and it costs $40 to make, that $40 is COGS.
3. Gross Profit
Gross profit is calculated as:
Gross Profit = Revenue - COGS
This tells you how efficiently your business produces or delivers its core offering.
If gross profit is weak, your pricing or production costs are a problem.
4. Operating Expenses (OPEX)
Operating expenses are the costs required to run your business that are not directly tied to production.
These include:
- Salaries (non-production staff)
- Marketing and advertising
- Rent and utilities
- Software subscriptions
- Insurance
- Administrative costs
These expenses can quickly grow out of control if not monitored.
5. Operating Income
Operating income is:
Gross Profit - Operating Expenses
This shows how much money your core business operations actually generate before taxes and interest.
This is one of the most important numbers in the entire P&L.
6. Other Income and Expenses
This section includes:
- Interest income or expense
- One-time gains or losses
- Investment income
- Loan costs
These are not part of normal operations but still impact final profit.
7. Net Profit (Bottom Line)
This is the final number:
Net Profit = All Revenue - All Expenses
It is called the “bottom line” because it appears at the bottom of the P&L.
This tells you whether your business actually made money or lost money during the period.
Example of a Simple P&L
Let’s make this real.
Imagine a small business:
- Revenue: $100,000
- COGS: $40,000
- Gross Profit: $60,000
Operating Expenses:
- Rent: $10,000
- Payroll: $25,000
- Marketing: $10,000
- Software: $5,000
Total Operating Expenses: $50,000
Operating Income: $10,000
Other Expenses:
- Interest: $2,000
Net Profit: $8,000
Even though the business made $100,000 in revenue, the actual profit is only $8,000. That is the power of the P&L statement.
Common Misunderstandings About P&L
Many business owners misinterpret their financials. Here are the most common mistakes.
1. Confusing revenue with profit
Revenue is not money you keep. It is money you collect before expenses.
2. Ignoring hidden expenses
Software subscriptions, small contractor costs, and fees add up quickly.
3. Not reviewing monthly
Looking at P&L once a year is too late to fix problems.
4. Overestimating cash flow
Profit does not always equal cash in the bank.
5. Not separating personal and business expenses
This makes your P&L inaccurate and misleading.
How to Read a P&L Like a CEO
If you want to think like a strong operator, focus on these key areas:
1. Revenue trend
Is revenue growing, flat, or declining?
2. Gross margin
Are you keeping enough profit after production costs?
3. Operating efficiency
Are expenses growing faster than revenue?
4. Net profit margin
What percentage of revenue actually becomes profit?
Example:
- Revenue: $100,000
- Net Profit: $10,000
- Net Margin = 10%
Higher margin = healthier business.
What a Strong P&L Looks Like
A healthy business typically shows:
- Consistent revenue growth
- Stable or improving gross margins
- Controlled operating expenses
- Positive net profit
- Predictable trends month over month
A weak P&L shows:
- Rising revenue but shrinking profit
- Uncontrolled expenses
- Negative or unstable margins
- Seasonal chaos with no planning
How Businesses Use P&L Statements Strategically
A P&L is not just a report. It is a decision-making tool.
Pricing decisions
If margins are too low, pricing must change.
Hiring decisions
If operating expenses are too high, hiring slows.
Marketing decisions
If customer acquisition costs are too high, marketing strategy needs adjustment.
Expansion decisions
If profit is stable and strong, expansion becomes safer.
P&L vs Balance Sheet vs Cash Flow
Many people confuse financial statements. Here is the simple breakdown:
P&L Statement
Shows profitability over time.
Balance Sheet
Shows what a company owns and owes at a point in time.
Cash Flow Statement
Shows actual movement of cash in and out.
A business needs all three, but the P&L is the most commonly used for performance tracking.
Why Small Businesses Fail Without Understanding P&L
Most small businesses do not fail because they lack revenue. They fail because:
- They don’t know their real margins
- They overspend during growth
- They misread profitability
- They scale losses instead of profits
A strong P&L discipline prevents these mistakes.
Frequently Asked Questions
What does P&L stand for and what does it show? P&L stands for Profit and Loss. A P&L statement shows how much money a business made in revenue, how much it spent on expenses, and whether it ended up profitable or not over a specific period. It is also called an income statement or profit and loss statement.
What is the difference between revenue and profit? Revenue is the total money collected from selling products or services before any expenses are paid. Profit is what remains after all expenses are subtracted. A company can bring in millions in revenue and still lose money, which is exactly why understanding the full P&L matters.
What are the main sections of a P&L statement? The core sections are revenue at the top, cost of goods sold, gross profit, operating expenses, operating income, other income and expenses such as interest, and net profit at the bottom. Each section builds on the one above it to show how revenue moves through the business and what actually remains.
What is the difference between gross profit and net profit? Gross profit is revenue minus the direct cost of producing your product or service. Net profit is what remains after all expenses including operating costs, interest, and taxes are subtracted. Gross profit tells you if your core offering is priced correctly. Net profit tells you if the entire business is financially healthy.
What are the most common P&L mistakes business owners make? The most common mistakes are confusing revenue with profit, ignoring small recurring expenses that add up, reviewing the P&L only once a year instead of monthly, assuming profit equals cash in the bank, and mixing personal and business expenses which makes the statement inaccurate.
How should a business owner actually use a P&L statement? Use it to track revenue trends over time, monitor whether gross margins are stable or shrinking, catch operating expenses growing faster than revenue, and calculate net profit margin. Strong operators use P&L data to drive pricing decisions, hiring decisions, marketing adjustments, and expansion planning rather than reacting to problems after they appear.
Final Thoughts
The P&L statement is not just an accounting document. It is a decision-making system.
If you understand your P&L, you understand your business.
If you ignore it, you are guessing.
The most successful business owners do not just look at revenue. They study their P&L consistently, break it down line by line, and use it to guide every major decision.
Once you learn how to read it properly, you stop reacting to business problems and start controlling them.
Updoot explains every section and makes it ultra easy to plug in your values and get a rollup that copies right to Excel.
Related articles on Finance
Direct Costs vs Indirect Costs: Definitions and Examples
Owners Draw: What It Is, How It Works
Revenue vs Sales: What Is the Difference
How to Lower Customer Acquisition Costs for Small Businesses
Annual Budget Template Google Sheets