
Excel Spreadsheets for Chief Operating Officer
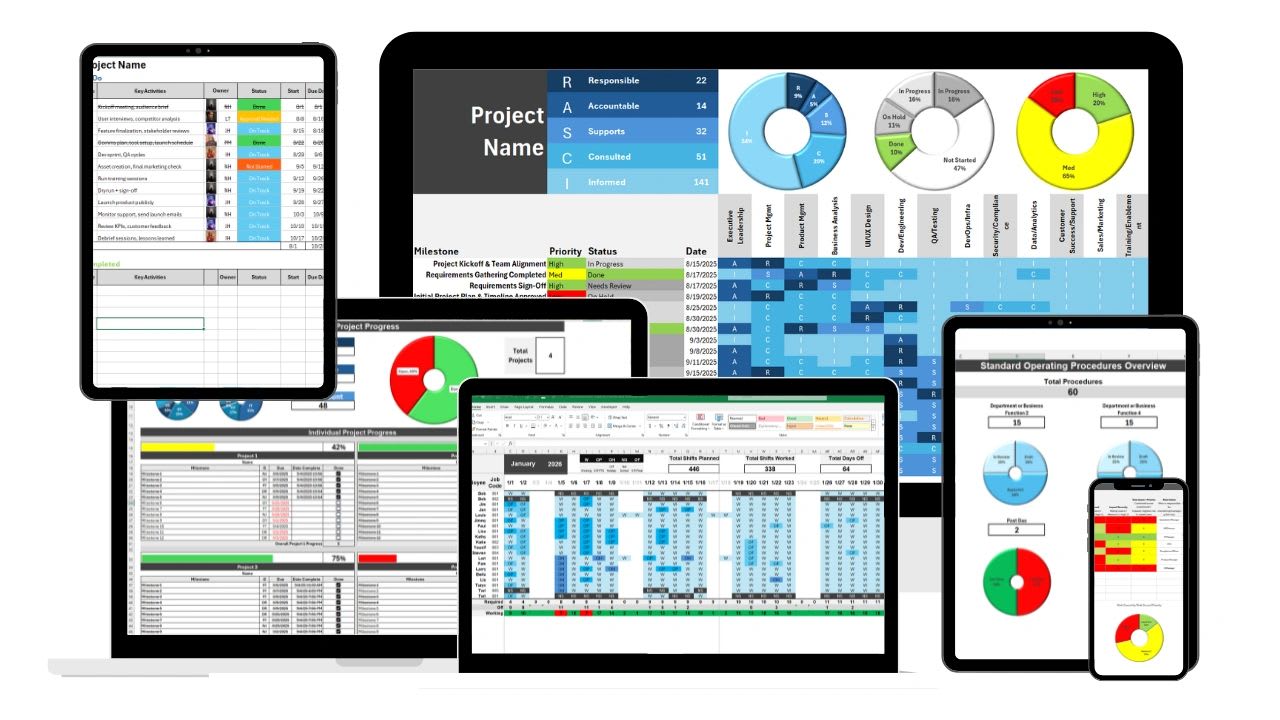
Excel spreadsheets for a Chief Operating Officer come down to five areas that cover everything a COO needs to track. There is a version of the COO role that runs on gut instinct, status-update emails, and dashboards nobody truly reads. That version of the COO is being left behind.
The modern COO runs on data, and the most accessible, flexible, and powerful data tool in the world is already on your desktop: Microsoft Excel.
This is not a tutorial on pivot tables. This is a strategic argument for why every Chief Operating Officer needs a master set of Excel spreadsheets organized around five core operational levers: People, Product, Performance, Promotion, and Process. These five levers represent the full scope of what a COO actually controls. Tracked carefully in purpose-built spreadsheets, they become the command center that separates reactive firefighting from proactive leadership.
A free five-lever scorecard at the end lets you set targets for each lever and see which one needs attention first.
Why Excel Spreadsheets Are Still the COO’s Most Powerful Tool
Enterprise software platforms promise to do everything. They rarely deliver cleanly. What they do deliver often requires months of implementation, expensive consultants, and workflows designed for a generic company rather than yours. Excel bends to you. It models the world the way you actually see it, not the way a software vendor imagined it.
For a COO, speed of insight is everything. When a board member asks a question you cannot answer until your BI team runs a report next Tuesday, you have already lost ground. When your Excel spreadsheet answers it in 30 seconds because you built it last quarter and kept it updated, you lead the conversation. That is the real competitive advantage of a well-designed COO spreadsheet system.
Beyond speed, Excel offers total transparency. You can see every formula, every assumption, every calculation. There are no black-box algorithms producing numbers you cannot explain. When you present to the CEO or the board, you know exactly where every figure came from. That confidence is what distinguishes operational leaders from operational managers.
COO Spreadsheet Lever 1: People
This is what a COO needs. Every operational outcome traces back to people. Headcount, capability, retention, and team health are not HR concerns that occasionally land on the COO's desk. They are the COO's primary input. You cannot scale operations with the wrong people in the wrong seats, and you cannot build consistency with a team that turns over every 18 months.
Your People spreadsheet should track these metrics.
| Metric | What it tells the COO |
|---|---|
| Total headcount by department | Whether capacity matches the plan |
| Open roles and time to fill | Where hiring is slowing execution |
| 90-day retention for new hires | Whether hiring and onboarding are working |
| Performance rating distribution by team | Where talent is strong or thin |
| Compensation benchmarks by role | Retention risk from pay gaps |
| Training hours per employee | Investment in capability |
| Succession coverage for critical roles | Risk if a key person leaves |
The insight this spreadsheet delivers is not just a headcount snapshot. It answers the most important operational question a COO faces: do we have the human capacity to execute our strategy? When you can see that your customer success team is at 73% capacity while your pipeline is growing 20% quarter over quarter, you do not need a consultant to tell you there is a problem.
You see it yourself, weeks before it becomes a crisis.
People data also keeps the COO grounded in the human cost of operational decisions. It is easy to approve a new initiative without asking who will execute it. The People spreadsheet makes that question unavoidable. Every time you add a strategic commitment, you return to the spreadsheet and ask who this falls on. The answer either confirms you have capacity or forces an honest conversation about tradeoffs.
Get the People lever spreadsheet ready-made.
COO Spreadsheet Lever 2: Product
This is what a COO needs. Product is where the COO and the product function meet. Whether your organization builds software, manufactures physical goods, or delivers services, there is a product, and the operations behind that product determine whether it reaches customers on time, at quality, and at the cost you modeled.
The Product spreadsheet gives the COO visibility into the pipeline and the delivery reality without needing to live inside the product team's project management tools.
Your Product spreadsheet should track these metrics.
| Metric | What it tells the COO |
|---|---|
| Roadmap milestones, planned vs actual dates | Whether delivery promises are kept |
| Defect rates and customer-reported issues | Quality trend |
| Cost of goods or delivery vs budget by product line | Margin pressure |
| Supplier or vendor performance | Supply risk |
| Inventory levels and stockout frequency, if applicable | Availability |
| NPS or CSAT by product or service | What customers experience |
The most valuable function of the Product spreadsheet is exposing the gap between what was promised and what was delivered. In most organizations, that gap is systematically underreported. Teams naturally present optimistic timelines and selectively surface quality issues. When the COO owns a spreadsheet that tracks planned versus actual delivery dates going back 12 months, the pattern becomes impossible to hide.
You can see whether your team consistently ships three weeks late and have a data-grounded conversation about why, rather than accepting optimistic forecasts for the next quarter.
Product data also connects directly to financial performance. When a product launch slips by six weeks, that slip has revenue implications. When defect rates spike, the cost of remediation lands somewhere in your P&L. The COO who tracks product alongside financial performance in connected spreadsheets sees these relationships in real time rather than discovering them during quarterly review.
Get the Product lever spreadsheet ready-made.
COO Spreadsheet Lever 3: Performance
This is what a COO needs. If People and Product are the inputs of your operation, Performance is the output. This is the spreadsheet most COOs think of first when they imagine operational data. Revenue, margin, utilization, conversion rates, customer lifetime value. The Performance spreadsheet is your scoreboard, and like any scoreboard, it only tells you who is winning.
The more interesting work is understanding why, and that is where the connections to the other four levers come in.
Your Performance spreadsheet should track these metrics.
| Metric | What it tells the COO |
|---|---|
| Revenue vs target by month and quarter | Whether the plan is on track |
| Gross and contribution margin by business unit | Where profit is made |
| Customer acquisition cost and lifetime value | Growth efficiency |
| Churn and net revenue retention | Customer health |
| Cash runway, if capital efficiency matters | How long the plan can run |
| Team utilization vs capacity | Room to take on more |
| Leading indicators such as pipeline value and proposal volume | What revenue looks like next quarter |
The Performance spreadsheet requires two things to be genuinely useful: consistency and honesty. Consistency means you update it on the same cadence every single week or month without exception. The moment you start updating it selectively, when numbers are good and not when they are bad, you lose the ability to identify patterns. Honesty means you include the metrics that are uncomfortable.
If churn is rising, it goes in the spreadsheet. A Performance tracker that only contains good news is not a management tool. It is a vanity document.
The COO who maintains a rigorous Performance spreadsheet over 18 to 24 months builds something extraordinarily valuable: a data history of their business. Seasonality becomes visible. The impact of specific decisions becomes traceable. When a board member asks whether a Q2 slowdown is structural or seasonal, you do not speculate. You open the spreadsheet, compare against Q2 of the prior two years, and give an answer grounded in evidence.
Get the Performance lever spreadsheet ready-made.
COO Spreadsheet Lever 4: Promotion
This is what a COO needs. Many COOs leave Promotion entirely to the CMO. That is a costly mistake. Promotion, the go-to-market engine that generates awareness, leads, and pipeline, is an operational function with a budget, a headcount, and measurable outputs that feed directly into your Performance numbers.
When the COO does not track Promotion, they cannot connect marketing spend to revenue outcomes, and they cannot hold the marketing function accountable the same way they hold every other function accountable.
Your Promotion spreadsheet should track these metrics.
| Metric | What it tells the COO |
|---|---|
| Marketing spend by channel vs budget | Where money goes |
| Lead volume by source and quality tier | Pipeline health, week over week |
| Conversion rate at each funnel stage | Where leads drop off |
| Cost per lead and per qualified opportunity by channel | Which channels earn more budget |
| Content output: publish rate and reach | Consistency of marketing |
| Brand search volume, if measurable | Awareness trend |
| Pipeline attributed to campaigns | Marketing’s revenue contribution |
The Promotion spreadsheet transforms marketing from a creative function into an accountable operational unit. When you can see that paid search generates leads at $180 each with a 12% close rate while content marketing generates leads at $40 each with an 18% close rate, you have the data to have a different budget conversation.
Not a conversation about what feels right, but one anchored in the specific economics of your business right now.
Promotion data also gives the COO early warning signals. Lead volume is a leading indicator of revenue, typically by 60 to 90 days depending on your sales cycle. When lead volume drops in February, you will feel it in revenue in April. The COO who tracks lead volume monthly sees February's drop in time to respond.
The COO who reviews marketing in a deck prepared by someone else sees April's revenue shortfall after it has already happened.
Get the Promotion lever spreadsheet ready-made.
COO Spreadsheet Lever 5: Process
This is what a COO needs. Process is where operational excellence lives or dies. Every repeatable activity in your organization, every customer onboarding, every invoice cycle, every hiring workflow, every support ticket resolution, follows a process. When those processes are documented, measured, and optimized, they generate compounding efficiency gains over time. When they are undocumented and inconsistent, they generate compounding drag.
The Process spreadsheet is how the COO keeps the organization's operating system sharp.
Your Process spreadsheet should track these metrics.
| Metric | What it tells the COO |
|---|---|
| Core SOPs with owner and last review date | Whether procedures are current |
| Cycle time for key processes vs target | Speed of execution |
| Error or rework rate for high-volume processes | Quality of execution |
| Automation coverage: manual vs automated | Where time can be recovered |
| Improvement projects in flight and expected impact | What is being fixed |
| Compliance items and audit readiness | Risk exposure |
| Usage of operations-critical software | Whether tools are adopted |
The Process spreadsheet surfaces a type of problem that rarely appears in financial reports: procedural waste. When your customer onboarding takes 14 days but your best competitor onboards in 4, that gap is costing you churn and competitive positioning. It will never appear as a line item on a P&L. It only becomes visible when you measure it deliberately, which is exactly what the Process lever exists to do.
Process data also enables the COO to prioritize improvement work rationally. Most organizations have more process problems than bandwidth to fix. Without data, the improvement projects that get attention are the ones championed most loudly. With a Process spreadsheet, you can rank opportunities by impact on cycle time, error rate, and cost, and allocate resources to the projects with the highest return. That is operational leadership rather than operational whack-a-mole.
Get the Process lever spreadsheet ready-made.
How the Five Levers Work Together for a Chief Operating Officer
Each lever spreadsheet is valuable on its own. Together, they are transformative. The five levers interact constantly, and the COO who tracks them in connected spreadsheets sees those interactions before they become problems.
Consider a common scenario. Revenue growth is slowing (Performance). The sales team says they do not have enough qualified leads (Promotion). Marketing says they are generating leads but sales is not converting them (People and Process). HR says the sales team has had three manager changes in 18 months and retention is poor (People). When you track all five levers, this diagnosis takes one review session.
When you track them in isolation or not at all, it takes a six-week consulting engagement that tells you what your own data already knew.
The five levers also create accountability architecture. When each lever has a spreadsheet, each spreadsheet has metrics, and each metric has an owner, leaders stop showing up to operations reviews with anecdotes. They show up with data, because they know the COO is going to ask for it. That cultural shift from opinion-based to evidence-based leadership is often the most valuable outcome of building this system.
Where to Start Building Your COO Spreadsheets
The most common mistake COOs make when building an operational data system is trying to build everything at once. Start with Performance. It is the most urgent because it tracks the outputs that matter most to your CEO and board. Pull together your revenue data, your margin data, and three to five leading indicators.
Set up a monthly update process and make it your habit to open this spreadsheet every Monday before you open your email.
In week two, build your People spreadsheet. Headcount, open roles, and recent hire retention are the three columns you cannot do without. In week three, add Process. Start with your ten most important recurring workflows and measure cycle time for each. Promotion and Product can follow as you build the habit of spreadsheet-first operations into your weekly rhythm.
Within 90 days you will have a five-lever system that is not perfect but is real. Real data about your actual operation, updated consistently, reviewed regularly. That is worth more than a perfectly designed system that lives only in planning documents.
| Timing | Build | Start with |
|---|---|---|
| Week 1 | Performance | Revenue, margin, and three to five leading indicators, reviewed every Monday |
| Week 2 | People | Headcount, open roles, and recent-hire retention |
| Week 3 | Process | Cycle time for your ten most important recurring workflows |
| Weeks 4 and on | Promotion and Product | Added as the weekly habit sticks |
| By day 90 | All five levers | A real system, updated consistently and reviewed regularly |
Free COO Five-Lever Scorecard
Use the scorecard below to put the five levers on one page. Add the metrics you track for each lever with a target, the latest actual, and whether higher or lower is better. Each metric is marked on target, watch if it is within 10% of target, or off track.
The scorecard then rolls the metrics up into a health score for each lever. In the example, Product and Performance are the healthiest levers at 75%, People sits at 25%, and Process is the weakest at 0%, because customer onboarding takes 14 days against a 7-day target and only 70% of SOPs were reviewed on schedule. That is where the COO should spend time first.
Copy the scorecard to Excel, where the status and lever health stay live formulas, or print it for your weekly operations review.
COO Five-Lever Scorecard
List the metrics you track for each lever, with a target, this period’s actual, and whether higher or lower is better. The scorecard marks each metric on target, watch (within 10% of target), or off track, rolls them up into a health score for each lever, and tells you which lever needs attention first. Nothing you enter is saved or sent anywhere.
Lever health
Leading Operations From Evidence With COO Spreadsheets
The Chief Operating Officer is responsible for making sure the organization can do what the CEO has promised it will do. That responsibility is impossible to discharge without clear, honest, current data about the five levers that drive every operational outcome: People, Product, Performance, Promotion, and Process.
Excel gives you the speed, flexibility, and transparency to build that data system without a six-month software implementation. The five-lever spreadsheet system is not a technology project. It is a leadership discipline. And like all disciplines, its power comes not from the day you build it, but from every day you use it.
Start with one lever. Update it every week. Add the next. Within a quarter, you will be leading your operation from evidence rather than instinct. Within a year, you will wonder how you led without it.
If your team is growing, the next logical step is a tool that adds collaboration and real-time data. Try Updoot for free; it is business management software for $5 per user per month.
Opens in Google Drive. View and download for free.
Related Reading
How to Hire a COO: Everything You Need to Know →
How to Create a KPI Tracker in Excel →
How to Achieve Operational Excellence for Small Businesses →
Frequently Asked Questions About Excel Spreadsheets for a COO
What Excel spreadsheets does a COO need?
A COO needs five core spreadsheets, one for each operational lever: People, Product, Performance, Promotion, and Process. Each tracks the key metrics for that lever, and together they give the COO a complete picture of the business in real time.
What are the five levers of a Chief Operating Officer?
People (talent, headcount, and team capacity), Product (quality, delivery, and development pipeline), Performance (KPIs, revenue, and financial health), Promotion (marketing, lead generation, and pipeline), and Process (SOPs, cycle times, and operational efficiency).
Why should a COO use Excel instead of enterprise software?
Excel gives COOs speed, flexibility, and full transparency. Unlike rigid enterprise platforms that take months to implement, Excel can be customized instantly to model the business exactly as it operates. Every formula is visible, every assumption is traceable, and no specialist is needed to update it.
How often should a COO update their operational spreadsheets?
Performance and Promotion data should be updated weekly at minimum. People, Product, and Process data can be updated monthly. The cadence matters less than the consistency.
What is the most important lever for a COO to track first?
Start with Performance. It tracks the outputs your CEO and board care about most and gives you an immediate foundation to build on. Add People next, since every operational outcome traces back to the people executing it.
How do the five levers connect to each other?
People capacity determines whether Product ships on time. Product quality drives Performance. Promotion generates the pipeline that shows up in Performance. Process efficiency determines how well People can execute across all the other levers.
Can a small or mid-size company use the five-lever spreadsheet system?
Yes, and it is arguably more valuable at smaller companies with less operational infrastructure. A 20-person company might track five columns per lever where a 500-person company tracks fifty, but the structure and the discipline are identical.