
Excel for Beginners: A Complete Guide to Getting Started

Excel for beginners can feel intimidating at first. Microsoft Excel is one of the most powerful tools there is for organizing information, doing calculations, and making sense of data, and the first time you open it, the grid of empty cells and the rows of buttons across the top can seem like a lot. The good news is that you only need a handful of skills to start using it confidently.
This guide walks through those skills in order: how the Excel window is laid out, how to enter and format data, how to write your first formulas, how to turn numbers into a chart, how to save time with AutoFill, and how to save and share your work. Each section explains what to click and why, so you can follow along even without a screenshot in front of you.
At the end, you will put everything together in a short practice exercise, building a simple budget. You can try it first in the free practice budget builder on this page, then copy it straight into Excel and finish it there.
1. Getting to Know the Excel Interface
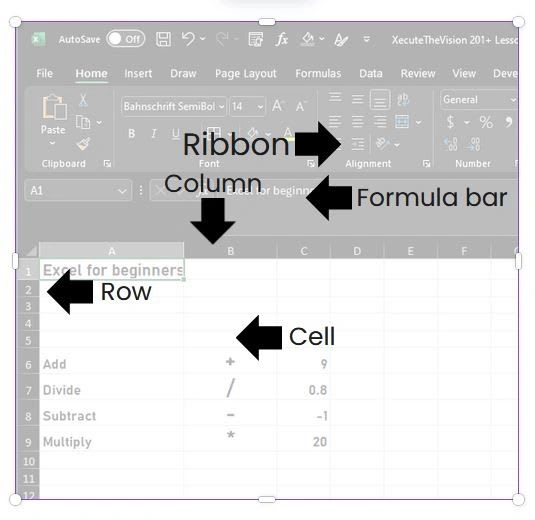
When you first open Excel, the screen can look complicated, but it breaks down into a few parts that you will use every day.
Workbooks and Sheets
Your entire Excel file is called a workbook. Each workbook contains one or more sheets, also called worksheets, which appear as tabs along the bottom of the window. You can click a tab to switch sheets, double-click it to rename it, or click the plus sign next to the tabs to add a new one. Many people keep related information in one workbook on separate sheets, such as one sheet for each month.
The Ribbon
The ribbon is the wide toolbar across the top of the window. It is organized into tabs such as Home, Insert, Formulas, and Data, and each tab holds a group of related tools. The Home tab, which is open by default, contains the tools you will use most, including fonts, number formats, and alignment. Insert is where you add charts and tables, and Formulas holds Excel's library of functions.
Cells, Columns, and Rows
The main part of the screen is a grid of small boxes called cells. Columns run up and down and are labeled with letters, starting with A, B, and C. Rows run across and are labeled with numbers, starting with 1, 2, and 3. Every cell has an address made from its column letter and row number, so the cell in column B, row 2 is called B2. Those addresses are how formulas refer to your data.
The Formula Bar
Just above the grid is the formula bar. When you click a cell, the formula bar shows exactly what is inside it, which may be different from what the cell displays. If a cell shows a total of 2,160, for example, the formula bar might reveal the formula that calculated it. You can type or edit a cell's contents directly in the formula bar, which is especially handy for long formulas.
Spend a few minutes clicking around these parts. Getting comfortable with where things are makes everything else in Excel much faster.
2. Entering and Formatting Data in Excel
To enter data, click any cell and start typing. You can type text, numbers, or dates. When you are done, press Enter to confirm the entry and move to the cell below, or press Tab to move one cell to the right. Pressing Tab across a row and then Enter at the end is a fast way to fill in a table row by row. To change something you already typed, click the cell and type over it, or double-click it to edit part of the contents.
Formatting makes your data easier to read. To make text bold, italic, or underlined, select the cells and use the buttons in the Font group on the Home tab, or use the keyboard shortcuts Ctrl and B, Ctrl and I, or Ctrl and U. The same group lets you change the font, size, and color, and add borders or a fill color to highlight headers.
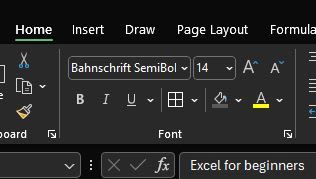
Numbers have their own formatting. Select the cells, right-click, and choose Format Cells to open a window where you can display numbers as currency, percentages, dates, and more. For quick changes, the Number group on the Home tab has buttons for currency and percent. Formatting only changes how a number looks, not its actual value, so 0.25 formatted as a percentage shows 25% but still calculates as 0.25.
3. Basic Excel Formulas and Functions
Formulas are where Excel really shines. A formula is an instruction that tells Excel to calculate something, and every formula starts with an equals sign. Typing =5+3 in a cell shows 8. More usefully, formulas can refer to other cells by their address, so =B2+B3 adds whatever is in those two cells and updates automatically when either number changes.
Functions are ready-made formulas for common jobs. The first one to learn is SUM, which adds up a range of numbers. A range is written as the first cell, a colon, and the last cell, so B2:B6 means every cell from B2 down to B6. Typing =SUM(B2:B6) in B7 adds all five numbers above it. If you later change one of those numbers, the total updates on its own.
The second function to learn is AVERAGE, which finds the average of a range. =AVERAGE(B2:B6) adds the numbers and divides by how many there are. Together, SUM and AVERAGE cover a surprising amount of everyday work, from totaling expenses to finding your average monthly sales. When you are ready for more, our Excel formulas cheat sheet covers dozens of formulas with examples.
A tip for beginners: instead of typing a range, you can type =SUM( and then click and drag across the cells you want. Excel fills in the range for you. Press Enter to finish.
4. Creating Simple Charts
Excel makes it easy to turn numbers into a picture. First, select the data you want to chart, including the labels in the first column and the numbers beside them. Then open the Insert tab on the ribbon and choose a chart type from the Charts group, such as a column, bar, line, or pie chart. Excel creates the chart immediately and places it on the sheet.
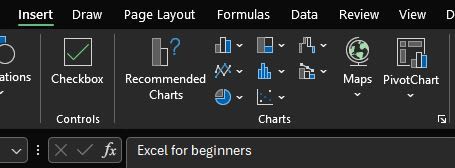
Once the chart appears, you can drag it to move it, drag its corners to resize it, and click the chart title to rename it. When a chart is selected, extra tabs appear on the ribbon with options to change the colors, layout, and style. As a rule of thumb, bar and column charts are best for comparing amounts, line charts for showing change over time, and pie charts only for showing parts of a single whole.
5. Speeding Up With AutoFill
AutoFill is one of the most useful time-savers for beginners. It fills in a series of data for you based on a pattern. Type January in a cell, then point to the small square in the bottom-right corner of the cell, called the fill handle. When the pointer turns into a thin plus sign, click and drag down, and Excel fills in February, March, and so on.
AutoFill works with numbers, dates, days of the week, and many other patterns. Type 1 and 2 in two cells, select both, and drag the fill handle to continue the count. It also copies formulas. If B7 contains a total for column B, dragging its fill handle to the right creates matching totals for columns C and D, adjusting the cell references automatically. That single trick saves an enormous amount of typing.
6. Saving and Sharing Your Work
Save early and save often. The first time you save, choose File and then Save As, pick a location, and give the workbook a name. The standard Excel format ends in .xlsx. After that, pressing Ctrl and S saves your latest changes. If you save to OneDrive or SharePoint, AutoSave can save your changes as you work.
To share a version people can view but not change, choose File, Save As, and pick PDF as the file type. To collaborate, save the workbook to OneDrive, then click Share in the top-right corner of Excel and invite colleagues by email. Everyone can then work on the same file, and you will see their changes appear.
7. Excel Practice Exercise: Build a Simple Budget
The best way to make these skills stick is to use them together. This short exercise uses nearly everything in this guide. In a new workbook, type Expense in A1 and Cost in B1, and make both headers bold. Below them, list a few monthly expenses, such as rent, groceries, and utilities, with the cost of each in column B.
In the row under your last expense, type Total in column A, and in column B write a SUM formula that adds up all the costs, such as =SUM(B2:B6). Format the cost column as currency using the Number group on the Home tab. Finally, select your expense names and costs, not the total, and insert a bar chart from the Insert tab to show which expenses are largest.
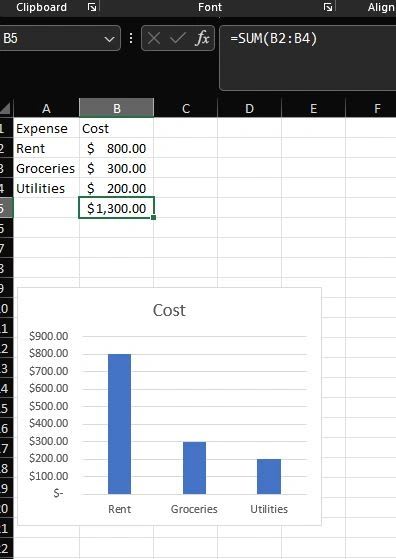
If you want to see the finished result before you start, use the practice budget builder below. It shows the cell layout, the exact formula to type, and a live chart, and it can copy the whole budget into Excel for you to format and chart yourself.
Practice Budget Builder
Build the practice exercise right here before you try it in Excel. Enter your expenses and the builder totals them with SUM, formats the amounts as currency, and draws a bar chart. Formula view shows exactly what to type in each cell. Copy to Excel pastes the whole sheet, formula included, into a blank workbook. Nothing you enter is saved or sent anywhere.
| A: Expense | B: Cost | ||
|---|---|---|---|
| Total | $0.00 |
Chart
Where to Go From Here
Congratulations. You now know how to find your way around Excel, enter and format data, write formulas, build a chart, save time with AutoFill, and save and share your work. That foundation covers a large share of everyday spreadsheet tasks.
The next step is practice. Pick a real task from your work or life, such as tracking hours, planning a project, or comparing prices, and build a sheet for it. Each new problem teaches you something, and before long Excel will feel like a natural tool instead of an intimidating one.
When you are ready to learn more, our free Excel courses and Excel course videos take you step by step from the basics to building complete business tools, and our guide to 10 Excel functions every user should know is a good next read.
Opens in Google Drive. View and download for free.
Frequently Asked Questions About Excel for Beginners
What should a beginner learn first in Excel?
Start with the interface, meaning workbooks, sheets, the ribbon, cells, and the formula bar. Then learn to enter and format data, write simple formulas with SUM and AVERAGE, create a chart, and use AutoFill.
How do you write a formula in Excel?
Click a cell, type an equals sign, then the calculation or function, such as =SUM(B2:B6), and press Enter. Formulas can refer to other cells by address, so the result updates when those cells change.
What is the difference between a workbook and a worksheet?
A workbook is the whole Excel file. A worksheet, or sheet, is one page of the grid inside it. A workbook can contain many worksheets, shown as tabs along the bottom.
How do I make a chart in Excel?
Select your labels and numbers, open the Insert tab, and choose a chart type such as column, bar, line, or pie. Excel creates the chart, which you can move, resize, and style.
What does AutoFill do in Excel?
AutoFill continues a pattern when you drag the fill handle in the corner of a cell. It can fill months, days, numbers, and dates, and it copies formulas while adjusting their cell references.
How long does it take to learn Excel basics?
Most people can learn the basics in this guide in a few hours of practice. Building real sheets for your own tasks is the fastest way to get comfortable.