
Understanding the Differences Between Financial Statements

When analyzing the financial health of a business, it's crucial to understand the differences and purposes of balance sheets, income statements, and profit and loss (P&L) statements. These financial documents are essential tools for decision-making and provide a comprehensive view of a company’s performance and position. Let’s dive into their definitions, distinctions, and examples to clarify their purposes.
1. Balance Sheet: The Snapshot of Financial Health
The balance sheet provides a snapshot of a company’s financial position at a specific point in time. It summarizes what the business owns (assets), what it owes (liabilities), and the equity remaining for shareholders.
Key Components
- Assets: Includes cash, inventory, equipment, accounts receivable, and property.
- Liabilities: Includes loans, accounts payable, and accrued expenses.
- Equity: Calculated as Assets - Liabilities.
The formula for a balance sheet is: Assets=Liabilities+Equity\text{Assets} = \text{Liabilities} + \text{Equity}Assets=Liabilities+Equity
Example
Imagine a company, "ABC Corp," on December 31, 2024:
- Assets: $500,000 (e.g., cash: $100,000, inventory: $200,000, equipment: $200,000)
- Liabilities: $300,000 (e.g., loans: $200,000, accounts payable: $100,000)
- Equity: $200,000
Balance Sheet Summary:

2. Income Statement: Tracking Profitability Over Time
The income statement, also known as the statement of earnings, shows a company's revenues, expenses, and profits or losses over a specific period (e.g., a month, quarter, or year). It measures financial performance and is key to assessing profitability.
Key Components
- Revenue: Income from sales or services.
- Expenses: Costs like salaries, rent, and utilities.
- Net Income: Calculated as Revenue - Expenses.
Example
For the year ending December 31, 2024, ABC Corp:
- Revenue: $800,000
- Expenses: $650,000 (e.g., salaries: $400,000, rent: $50,000, utilities: $20,000, other: $180,000)
- Net Income: $800,000 - $650,000 = $150,000
Income Statement Summary:

3. Profit and Loss (P&L) Statement: A Detailed View of Income
The profit and loss statement is often used interchangeably with the income statement. While both show revenues, expenses, and net income, the P&L statement typically provides more detailed insights, breaking down each category to provide granular information.
Key Components
- Gross Profit: Revenue - Cost of Goods Sold (COGS).
- Operating Expenses: Costs not directly tied to production, like marketing and R&D.
- Net Profit: Income after all expenses, taxes, and interest.
Example
Let’s extend the income statement for ABC Corp to a detailed P&L:
- Revenue: $800,000
- COGS: $300,000
- Gross Profit: $500,000 ($800,000 - $300,000)
- Operating Expenses: $350,000
- Net Profit: $150,000 ($500,000 - $350,000)
P&L Statement Summary:

How Are These Statements Different?
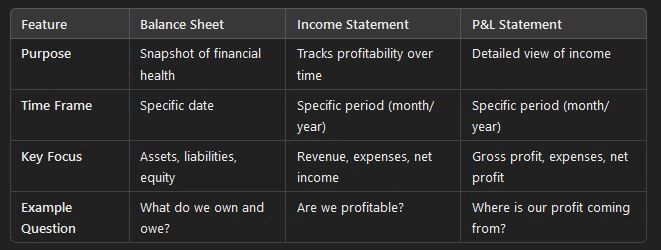
While all three financial statements are interconnected, each serves a unique purpose. The balance sheet reveals the company’s current financial position, the income statement summarizes its overall performance, and the P&L statement dives into profitability details. Understanding these differences is crucial for analyzing business health and making informed financial decisions.
Track budget and utilize the P&L function in Updoot free today.