
Customer Support Metrics That Matter, How to Track and Act
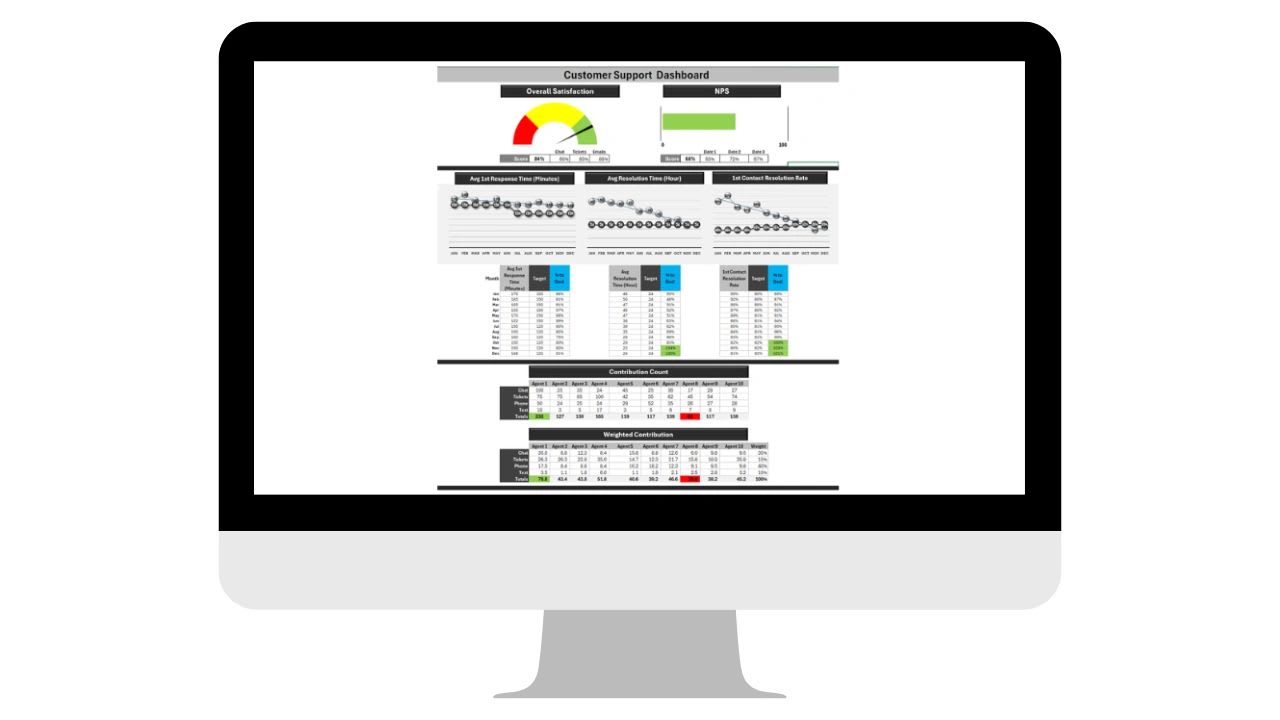
Customer support metrics show how well your team is serving customers and where to improve. Support is not just about answering questions. It is about delivering an experience that keeps customers loyal, turns them into advocates, and helps the business grow.
The challenge is that you cannot improve what you do not measure. Tracking the right support metrics gives you a real-time view of team performance, customer satisfaction, and operational efficiency, and it guides better decisions about staffing, training, and processes.
This guide covers the eight support metrics that matter most: what each one means, how to calculate it, why it matters, and what to do when the numbers move the wrong way. A free KPI calculator helps you measure your own team against targets.
The 8 Customer Support Metrics at a Glance
| Metric | Measures | Better when |
|---|---|---|
| First response time | Speed of the first reply | Lower |
| Average resolution time | Time to fully solve a ticket | Lower |
| First contact resolution | Share solved in one interaction | Higher |
| CSAT | Satisfaction with a specific interaction | Higher |
| NPS | Overall loyalty and likelihood to recommend | Higher |
| Tickets opened vs. closed | Whether the backlog is growing | Closed at or above opened |
| SLA compliance | Share of tickets meeting promised times | Higher |
| Top issue types | What customers contact you about most | Fewer repeat issues |
1. First Response Time (FRT)
What it is: The average time a customer waits for the first reply after submitting a ticket.
How to calculate it: Add up the time between each ticket being created and its first human reply, then divide by the number of tickets. Many teams report it in business hours so nights and weekends do not distort it.
Why track it: Customers value speed. A slow first response sets a frustrating tone for the whole interaction, even if the issue is resolved quickly afterward.
What to do when it slips: Review staffing levels during peak hours and shift schedules to match ticket volume. Send an automatic acknowledgment with a realistic reply time, even when a full answer will take longer. Route high-priority tickets, such as those from key accounts or about outages, to a fast-lane queue.
2. Average Resolution Time (ART)
What it is: The average time it takes to fully resolve a ticket from the moment it is opened.
How to calculate it: Add up the time from creation to resolution for all resolved tickets, then divide by the number resolved.
Why track it: Short resolution times usually mean efficient processes and good knowledge resources. Long ones point to bottlenecks, handoffs, or knowledge gaps.
What to do when it slips: Audit your most common ticket types and create help articles, saved replies, or macros for them. Look for stages where tickets sit idle, such as waiting on another department, and remove the roadblock. Pair newer agents with experienced ones to speed up learning.
3. First Contact Resolution (FCR)
What it is: The percentage of tickets resolved in the first interaction, with no follow-up needed.
How to calculate it: Divide the number of tickets resolved on first contact by the total tickets resolved, then multiply by 100.
Why track it: A higher FCR means less effort for customers, higher satisfaction, and a lighter workload for your team, because every extra touch is another ticket to handle.
What to do when it slips: Train agents to ask clarifying questions up front. Keep the knowledge base complete and current. Give agents the authority to make common decisions, such as small refunds or replacements, without escalating.
4. Customer Satisfaction Score (CSAT)
What it is: A short survey score collected right after an interaction, usually on a 1 to 5 scale.
How to calculate it: Divide the number of satisfied responses, typically 4 or 5 on a 5-point scale, by the total number of responses, then multiply by 100.
Why track it: CSAT gives direct feedback on service quality from the customer’s point of view, tied to a specific interaction.
What to do when it slips: Review negative ratings quickly and follow up personally with the customer. Look for common complaints and fix the underlying process. Recognize high-performing agents publicly to reinforce what good service looks like.
5. Net Promoter Score (NPS)
What it is: A measure of overall customer loyalty based on the question, "How likely are you to recommend us to a friend or colleague?" answered on a 0 to 10 scale.
How to calculate it: Subtract the percentage of detractors, who score 0 to 6, from the percentage of promoters, who score 9 or 10. The result ranges from -100 to 100.
Why track it: NPS is a leading indicator of retention and referrals. Because it measures the whole relationship, a low NPS can reflect issues beyond support, such as product quality or pricing.
What to do when it slips: Segment responses by customer type to see where advocacy is strongest and weakest. Group detractor comments by theme and address the biggest ones systematically. Share positive feedback across the company so everyone sees the impact of good service.
6. Tickets Opened vs. Tickets Closed
What it is: The balance between new tickets and resolved tickets in a period.
How to calculate it: Subtract tickets closed from tickets opened. A positive number means the backlog grew during the period.
Why track it: If you consistently open more tickets than you close, a backlog builds, and response and resolution times will eventually suffer.
What to do when it slips: Add temporary capacity or overtime to get ahead of a backlog. Review ticket categories to find recurring problems that can be fixed at the source. Reach out proactively, for example with status updates during an incident, so customers do not need to submit tickets.
7. SLA Compliance Rate
What it is: The percentage of tickets handled within the response or resolution times promised in your service level agreements.
How to calculate it: Divide the number of tickets that met the SLA by the total number of tickets, then multiply by 100.
Why track it: Missing SLAs damages trust, especially with high-value customers who pay for a guaranteed level of service.
What to do when it slips: Sort the queue by time remaining before breach so the most urgent tickets are handled first. Set up automatic alerts for tickets at risk. If targets are consistently missed, check whether they are realistic for your current staffing.
8. Top Issue Types
What it is: The most common categories of customer contacts.
How to calculate it: Tag every ticket with a category, then count tickets by category for the period and rank them.
Why track it: This is a goldmine for root cause analysis. Repeated issues often point to problems with the product, onboarding, billing, or documentation that support alone cannot fix.
What to do when it slips: Share the top issues with product and operations teams and agree on fixes. Update help articles and onboarding materials to prevent the most common questions. Give agents quick links and saved replies for top issues so they can handle them faster.
Free Customer Support KPI Calculator
The calculator below turns a period's help desk numbers into the KPIs above. Enter tickets opened and closed, average first response and resolution times, first contact resolutions, CSAT responses, NPS percentages, and tickets resolved within SLA. It calculates each KPI, compares it with the target you set, and suggests the first action for anything behind.
The example targets are common starting points, not industry standards, so adjust them to your own history and customer promises. Copy the results to Excel, where every KPI and status is a live formula you can update each week or month.
Customer Support KPI Calculator
Enter a period's support numbers from your help desk. The calculator works out first contact resolution, CSAT, NPS, SLA compliance, and backlog change, compares each KPI with a target you set, and tells you which fix to try first. Copy it to Excel with live formulas or print it for your team review. Nothing you enter is saved or sent anywhere.
| KPI | Result | Target | Status | First action if behind |
|---|
How to Pull It All Together
Each metric is useful on its own, but together they tell the full story of your support operation. Speed metrics, first response and resolution time, show how quickly you respond. Quality metrics, first contact resolution, CSAT, and NPS, show how well you solve problems. Workload metrics, tickets opened versus closed and SLA compliance, show whether your team has the capacity it needs. And top issue types show where to prevent tickets altogether.
Review them together on a regular schedule, weekly for the team and monthly for leadership. Look at trends rather than single data points, and read metrics in pairs. Faster resolution with falling CSAT, for example, can mean agents are closing tickets too quickly. Our guide to top customer support KPIs for small business offers more ways to combine them.
Common Mistakes With Support Metrics
Chasing speed at the expense of quality. Rushing to close tickets improves resolution time but increases reopened tickets and hurts satisfaction.
Tracking too many metrics. Choose the handful that match your goals and review them consistently.
Ignoring the context behind the numbers. A spike in ticket volume after a product release is a different problem from a slow decline in CSAT.
Using metrics to punish. Metrics work best as coaching tools. Agents who feel judged by a single number learn to game it.
A Faster Way: Customer Support KPI Dashboard
Tracking these metrics by hand across spreadsheets, reports, and tools takes time. Our Customer Support KPIs and Contribution dashboard gives you everything in one view, with pre-built tracking for CSAT, NPS, first response time, average resolution time, first contact resolution, and weighted agent contribution. It shows performance against goals automatically, so you can see where you are ahead or behind, and it is designed around action, not just numbers. Plug in your data and you have a live view of your team in minutes. Get the template here.
And when support work connects to the rest of the business, such as time tracking, projects, and team performance, Updoot is business management software that keeps it all in one place for $5 per user per month. You can start a free trial anytime.
Final Thoughts
The right customer support metrics turn service from a cost center into a growth engine. Track speed with first response and resolution time, quality with first contact resolution, CSAT, and NPS, and capacity with backlog and SLA compliance, then use top issue types to prevent problems at the source. Review them regularly, act on what they tell you, and you will spend less time chasing reports and more time improving service, developing your team, and delighting customers.
Opens in Google Drive. View and download for free.
Related Reading
Top Customer Support KPIs for Small Business →
Frequently Asked Questions About Customer Support Metrics
What are the most important customer support metrics?
First response time, average resolution time, first contact resolution, CSAT, NPS, tickets opened versus closed, SLA compliance, and top issue types together cover speed, quality, capacity, and root causes.
How is first contact resolution calculated?
Divide the number of tickets resolved in the first interaction by the total number of tickets resolved, then multiply by 100.
What is the difference between CSAT and NPS?
CSAT measures satisfaction with a specific interaction, usually right after it happens. NPS measures overall loyalty and how likely a customer is to recommend you, which reflects the whole relationship, not just support.
How do you calculate CSAT?
Divide the number of satisfied responses, typically 4 or 5 on a 5-point scale, by the total number of responses and multiply by 100.
What is SLA compliance?
SLA compliance is the percentage of tickets handled within the response or resolution times promised in your service level agreements.
How do I reduce a growing support backlog?
Add temporary capacity, prioritize tickets closest to their SLA deadlines, and fix the most common recurring issues at their source so fewer tickets arrive.
How often should support metrics be reviewed?
Weekly with the support team to manage day-to-day performance, and monthly with leadership to spot trends and plan staffing and improvements.