
Budgeting Revenue and Expenses by Business Function
Budgeting revenue and expenses by business function means planning and tracking your money by the parts of the business that earn it and spend it, rather than as one company-wide total. When you are running a business, the money going in and out can feel like a blur. Revenue comes in from multiple sources, expenses are scattered across departments, and before long it is hard to tell which parts of the business are pulling their weight and which are dragging you down.
That is why this approach is so useful. Instead of treating your company's finances as one big lump sum, you break them down into the key areas or functions of your business. The result is sharper insight, better financial decisions, and a company that stays on a sustainable path for growth.
This guide explains what functional budgeting means, why top-level budgeting falls short, a worked example, the benefits, and a six-step process. It also includes a free budget vs. actual tracker by function.
What Does It Mean to Budget by Business Function?
At its core, budgeting by function means aligning income and expenses with the departments or activities that generate them. Every business is organized a little differently, but most share a handful of common functions.
Sales and Marketing brings in revenue from customer sales and spends on advertising, sales commissions, customer acquisition campaigns, and trade shows. Operations covers the costs of producing and delivering goods or services, such as raw materials, logistics, suppliers, and production. Human Resources carries salaries, benefits, recruitment, employee training, and retention programs.
Finance and Administration includes accounting, legal fees, insurance, office supplies, and software subscriptions. Product or Service Development covers research and development, new feature launches, and other investments in innovation.
| Function | Typical revenue | Typical expenses |
|---|---|---|
| Sales and Marketing | Revenue from customer sales | Advertising, sales commissions, customer acquisition campaigns, trade shows |
| Operations | Revenue from delivering services, where billed separately | Raw materials, logistics, suppliers, production costs |
| Human Resources | Usually none | Salaries, benefits, recruitment, employee training, retention programs |
| Finance and Administration | Occasionally services billed out | Accounting, legal fees, insurance, office supplies, software subscriptions |
| Product or Service Development | Revenue from new products or product lines | Research and development, new feature launches, innovation investments |
By categorizing revenue and costs this way, you are effectively creating a financial scorecard for each part of your business.
Why Traditional Budgeting Falls Short
Many small and mid-sized businesses take a simple approach: track total income and subtract total expenses. That gives a quick sense of whether you are profitable, but it does not tell you where the money is being earned or lost.
Imagine your overall revenue looks strong at $1M. Without a breakdown, you might not notice that your operations team is consistently going over budget while your marketing campaigns are producing returns far above expectations. Without that visibility, you could cut the wrong costs or miss the chance to double down on what is working.
Budgeting only at the top level is like driving a car with a speedometer but no fuel gauge, no engine temperature, and no oil light. You know how fast you are going, but you do not know whether you are about to run into trouble.
Real-World Example: The Power of Functional Budgeting
Say your business brings in $1M a year. Broken down by function, it might look like this.
| Function | Revenue | Expenses | Net gain or loss |
|---|---|---|---|
| Sales and Marketing | $400K | $150K | $250K |
| Operations | $300K | $200K | $100K |
| Product Development | $200K | $250K | -$50K |
| HR, Finance, and Admin | $100K (services billed out, if applicable) | $100K | $0 |
| Total | $1M | $700K | $300K |
At the top line, the business shows $1M in revenue and $700K in expenses, leaving $300K in profit. That looks good.
The breakdown tells another story. Sales and Marketing is overperforming, returning $250K on $150K of spending, while Product Development is underperforming, losing $50K. With that detail, you can make strategic decisions, such as scaling back development costs until the new product proves profitable, or reinvesting more in the marketing campaigns that are producing high returns.
A Note on Shared Costs
Some costs, such as rent, utilities, and company-wide software, serve every function. You can keep them in Finance and Administration, as in the example, or allocate them across functions using a simple driver such as headcount or square footage. Whichever method you choose, use it consistently from month to month so the comparisons stay fair.
Benefits of Tracking Revenue and Expenses by Function
When you start categorizing your budget this way, several advantages appear quickly.
Clarity on profitability. You know exactly which areas are driving profit and which cost more than they contribute.
Smarter decisions. Instead of making broad cuts, you can target changes where they will have the most impact. You may not need to cut salaries at all; you may just need to renegotiate vendor contracts in operations.
Team accountability. Department heads and managers can take ownership of their numbers. When each function is responsible for its own budget, accountability goes up and waste goes down.
Forecasting for growth. Historical trends by function help you predict what is likely to happen next. If marketing spend has consistently tripled its return, you know it is worth allocating more dollars there.
Early warning signs. Overspending in one function can drag down the whole business. Breaking out the numbers lets you spot inefficiencies and address them before they snowball.
Alignment with strategy. If your strategy is to grow through innovation, your budget should show it. Tracking expenses by function makes sure money follows strategy, not habit.
How to Create a Budget by Business Function
If you are ready to try this approach, the process takes six steps.
| Step | What to do | Output |
|---|---|---|
| 1. List functions | Choose four to seven functions that match how you run the business | Rows of your budget |
| 2. Forecast revenue | Estimate what each revenue-producing function will bring in | Revenue budget by function |
| 3. Assign expenses | Put every cost, including salaries and software, into one function | Expense budget by function |
| 4. Set goals | Agree targets with each function's owner | Targets and owners |
| 5. Track actuals monthly | Enter actual revenue and expenses each month | Budget vs. actual |
| 6. Review and adjust | Investigate variances and reallocate where needed | Decisions and a revised forecast |
1. List Your Business Functions
Start with the categories that make the most sense for your company. Keep them broad enough to be manageable but specific enough to give useful insight. Four to seven functions is a practical range for most small businesses.
2. Forecast Revenue for Each Function
If certain teams directly generate revenue, such as sales, services, or product lines, estimate what each will bring in over the year. Functions that do not earn revenue simply show zero on this line.
3. Assign Expenses to Each Function
Break down expected costs and align them to the right area. Salaries, tools, software, and overhead should all be categorized. Every dollar should land in exactly one function so nothing is double counted.
4. Set Budgets and Goals
Define targets for each function, such as revenue growth for sales or cost containment for operations. Agree on these with the person who owns each function so the goals are realistic and owned.
5. Track Actuals Monthly
Update your budget with actual numbers as the year progresses. This turns the budget into a living document instead of a one-time plan. Monthly is frequent enough to catch problems and light enough to keep up with.
6. Review and Adjust
Compare budget with actuals to see where you are off track and make course corrections quickly. A variance is not automatically bad. Spending more in a function that is also earning more can be exactly the right call, which is why the tracker below looks at both expenses and net results.
Free Budget vs. Actual Tracker by Function
Use the tracker below to compare budgeted and actual results for each function. It calculates each function's budgeted and actual net, the net variance, and how far expenses are from budget as a percentage. Functions whose expenses exceed budget by more than your tolerance and whose net is behind plan are flagged as over budget. If expenses are over but the extra spending is paying off in net results, the function is marked over, net ahead. Functions earning less net than planned are flagged as below plan.
The example uses the $1M business above with a few months of actuals entered. Copy it to Excel, where every calculated column and the totals row are live formulas, or print it for your monthly review.
Budget vs. Actual by Business Function
List your business functions, enter the budgeted and actual revenue and expenses for each, and the tracker works out each function's net gain or loss, how far actuals are from budget, and which functions need attention. Copy it to Excel with live formulas or print it for your monthly review. Nothing you enter is saved or sent anywhere.
A Simple Tool to Make Tracking Revenue and Expenses Easier
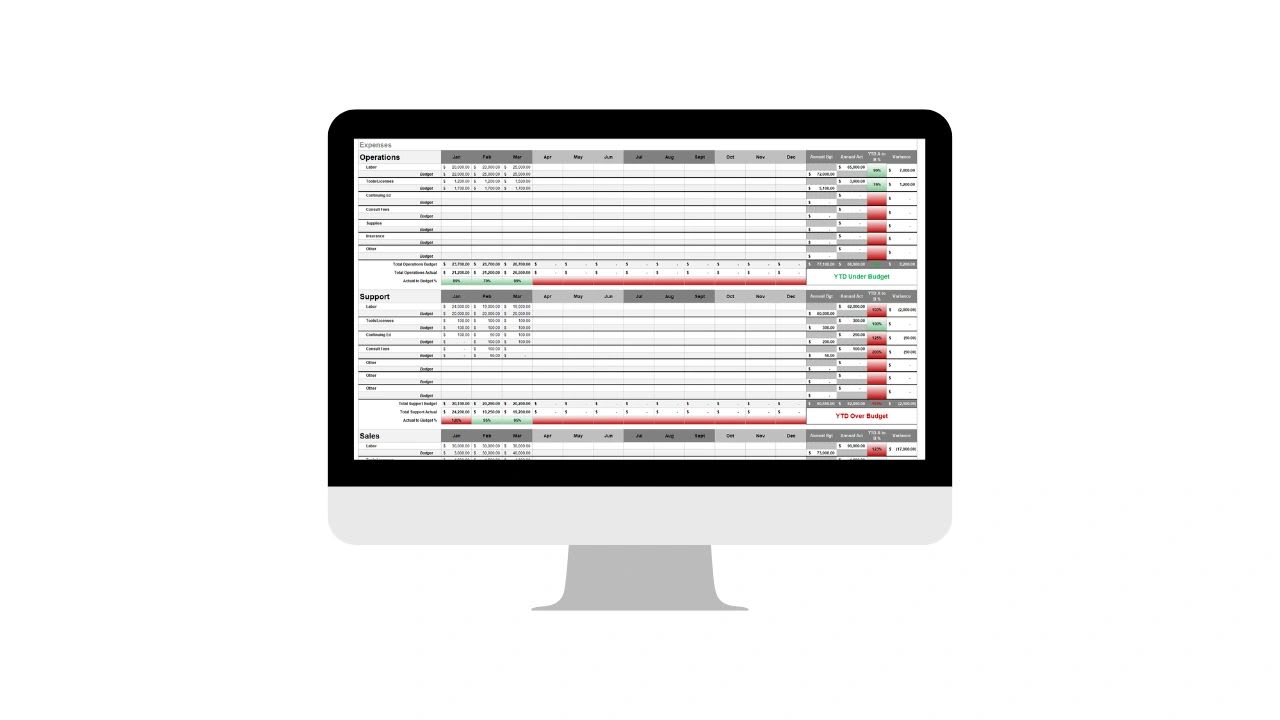
Budgeting by business function might sound complex, but it does not have to be. That is why I created the Annual Budget Forecast and Expense Tracker, a simple but powerful spreadsheet tool that organizes everything for you.
It lets you plan ahead by forecasting income and expenses for the year, broken down by function. It keeps you organized, with everything in one tracker instead of several messy spreadsheets. You enter actuals each month and instantly see how spending compares to budget, and visual summaries show where revenue is strong, where expenses are creeping up, and where adjustments are needed. The result is a clear view of whether to cut, hold, or invest more in each area of your business.
Instead of spending hours juggling numbers or worrying about missing details, you get a clear financial dashboard that ties directly to how your business operates. When you are ready to run budgets alongside your team's projects and time tracking, Updoot is business management software with budgeting built in, for $5 per user per month.
Final Thoughts
Budgeting revenue and expenses by business function is not just a bookkeeping exercise. It is a growth strategy. By connecting financial data to the actual activities of your business, you gain insight that helps you cut waste, double down on what is working, and prepare for sustainable growth.
Whether you are a startup founder trying to stay lean or a small to mid-sized business owner looking to scale, this method gives you the visibility and control you need.
If you are ready to stop guessing where your money goes and start budgeting with confidence, try the Annual Budget Forecast and Expense Tracker. It is designed to make functional budgeting easy, intuitive, and effective, so you can spend less time on spreadsheets and more time growing your business.
Opens in Google Drive. View and download for free.
Frequently Asked Questions About Budgeting by Business Function
What is budgeting by business function?
It means planning and tracking revenue and expenses by the parts of the business that earn and spend them, such as sales and marketing, operations, HR, finance and administration, and product development, instead of as one company-wide total.
Why is budgeting by function better than a single total budget?
A single total shows whether you are profitable but not where money is earned or lost. A functional budget shows which areas overperform and which drain profit, so you can make targeted decisions.
How many business functions should I use?
Four to seven is practical for most small businesses. Use categories broad enough to manage but specific enough to show useful differences.
How do I handle shared costs like rent?
Either keep them in finance and administration or allocate them across functions with a simple driver such as headcount or square footage. Use the same method every month.
How often should I compare budget to actual?
Monthly. It is frequent enough to catch overspending early and manageable enough to keep up with.
Is being over budget always bad?
No. Higher spending in a function that is also earning more can be the right call. Look at net results as well as expenses before cutting.
Can I track a functional budget in Excel?
Yes. The free tracker on this page copies to Excel with live formulas for net, variance, expense variance percentage, status, and totals.